Figure 5.
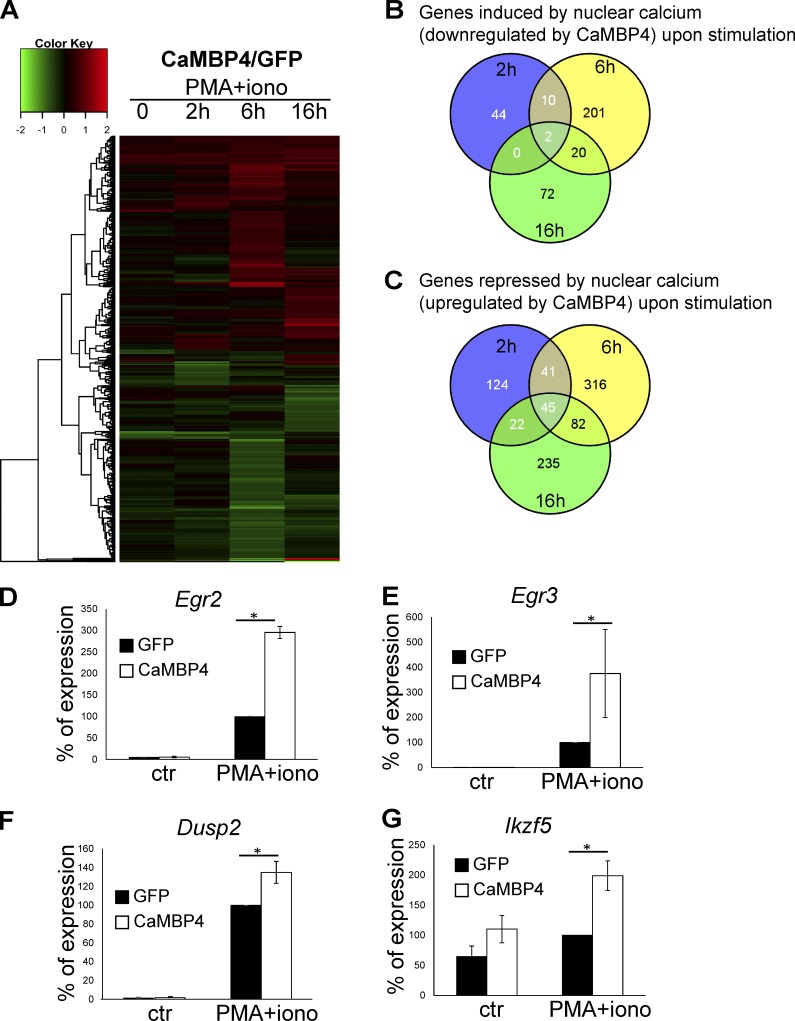
Analysis of nuclear calcium–regulated human T cell adaptogenomics. Representation of gene profiling data of human T cells transfected with expression vectors for CaMBP4.GFP (CaMBP4) or GFP and stimulated with a combination of PMA and ionomycin for 2, 6, and 16 h. (A) Heatmap with cluster dendrogram of 939 genes differentially expressed (log2 fold change) in at least one condition. Maximum value is set to 2.0. Fold ratio values greater than or equal to 2.0 are depicted with saturated red; values less than or equal to −2.0 are depicted with saturated green. (B and C) Number of genes induced by nuclear calcium signaling (i.e., down-regulated by CaMBP4.GFP; B) and repressed by nuclear calcium signaling (up-regulated by CaMBP4; C) at different time points on the basis of Illumina Human Sentrix-12 BeadChip arrays. (D–G) Validation of gene regulatory events by QRT-PCR. Gene expression was analyzed in T cells transfected with expression vectors for CaMBP4.GFP (CaMBP4) or GFP. Cells were stimulated with a combination of PMA and ionomycin for 2 h (Egr2 and Egr3) and 6 h (DUSP2 and Ikzf5) or were left unstimulated (ctr). mRNA levels are expressed relative to those in GFP-expressing T cells stimulated with PMA and ionomycin, which was set to 100% (n = 3). Statistically significant differences are indicated with an asterisk (*, P < 0.05). Error bars represent SEM.

