Figure 3.
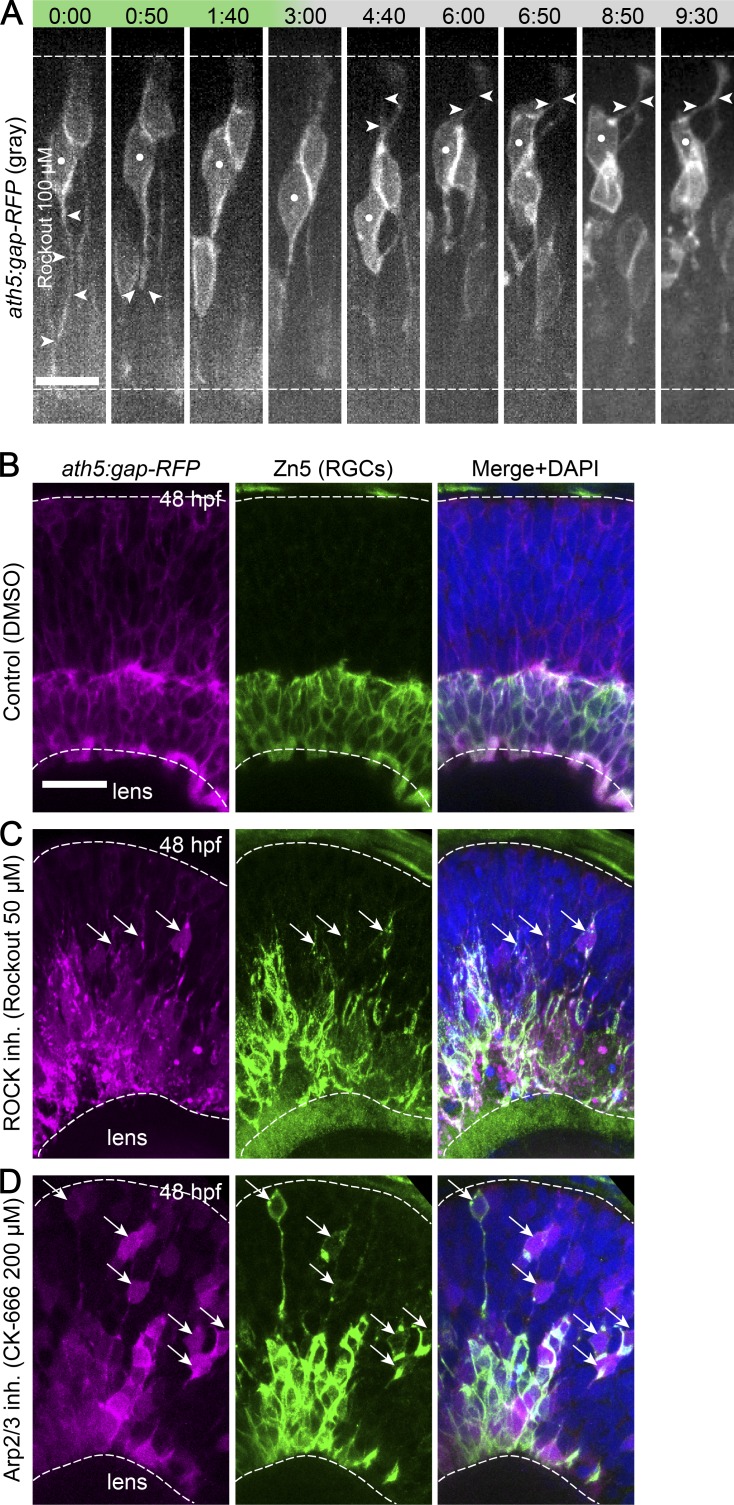
Basal process attachment is important for RGC translocation. (A) RGC translocation after ROCK inhibition. ath5:gap-RFP fish were imaged in a spinning disk microscope from 34 hpf. 100 µM Rockout was added at the start of imaging. White dots, RGC followed; arrowheads, basal and apical process. Time is shown in hours and minutes. Bar, 10 µm. (B) Zn5 staining for differentiated RGCs in control retina at 48 hpf. (C) Zn5 staining for differentiated RGCs after ROCK inhibition. (D) Zn5 staining for differentiated RGCs after Arp2/3 inhibition. (B–D) Arrows, ectopic RGCs. Dashed lines represent apical and basal sides. Bar, 20 µm.

