Figure 1.
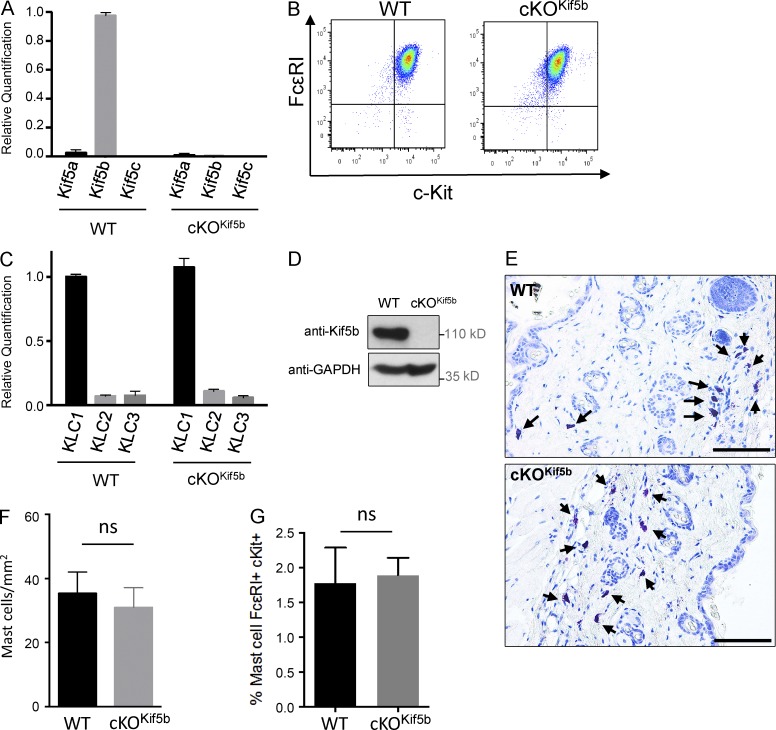
Kif5 expression in BMMCs and cKOKif5b MC maturation. (A) Relative quantification of Kif5a, Kif5b, and Kif5c transcripts by real-time PCR in BMMCs from WT and cKOKif5b mice. Transcript levels for each sample were expressed as a proportion of the mean value for Kif5b. The data are representative of three independent experiments performed in triplicate. (B) Expression of FcεRI and c-Kit on BMMCs from WT and cKOKif5b mice, as determined by flow cytometry. (C) Relative quantification of KLC1, KLC2, and KLC3 transcripts by real-time PCR in BMMCs from cKOKif5b and WT mice. Transcript levels for each sample were expressed as a proportion of the mean value for KLC1. The data are representative of three independent experiments performed in triplicate. (D) WT and cKOKif5b BMMC lysates were separated by SDS-PAGE and were immunoblotted with anti-Kif5b and anti-GAPDH antibodies. The blots are representative of three independent experiments. (E) Toluidine blue staining of MCs in the back skin of WT and cKOKif5b mice. Arrows indicate MCs. Bars, 100 µm. (F) The corresponding absolute MC counts per millimeter squared (mean ± SD). Three histological sections per animal were analyzed for WT (n = 3) and cKOKif5b (n = 3) mice. (G) Flow cytometry determination of the proportion of c-Kit– and FcεRI-expressing peritoneal MCs obtained from WT (n = 5) and cKOKif5b (n = 5) mice. Error bars represent SD. ns, not significant.

