Figure 3.
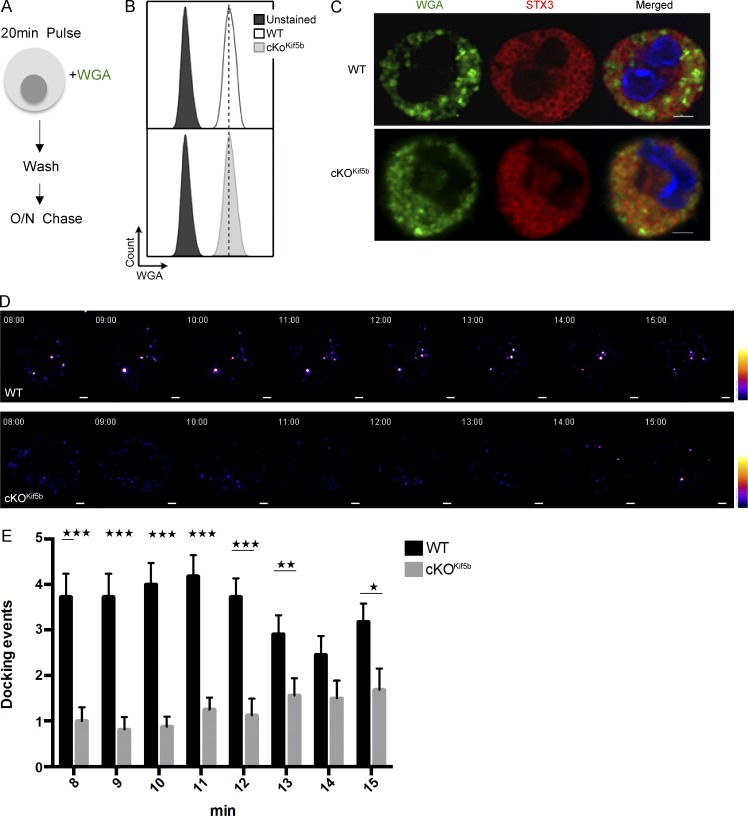
The dynamic recruitment of SGs to the plasma membrane upon FcεRI activation is impaired in the absence of Kif5b. (A) Schematic representation of the WGA labeling protocol for BMMCs. WT and cKOKif5b BMMCs were pulsed with Alexa Fluor 488–conjugated WGA and washed. An 18-h chase was then performed. (B) According to flow cytometry, WGA uptake was equivalent in WT and cKOKif5b BMMCs. (C) WT and cKOKif5b BMMCs were labeled with WGA-488 and plated on fibronectin-coated glass coverslips. Cells were then fixed, permeabilized, and stained with anti-STX3. (D) TIRF video microscopy was performed on IgE-sensitized WT and cKOKif5b BMMCs labeled with WGA-488 (green) and then plated on fibronectin-coated glass coverslips. The addition of 20 ng/ml DNP-HSA represents t = 0 of the acquisition. Representative series of images are shown every minute, from 8 to 15 min. A pseudocolor scale from blue (very weak intensity) to white (highest intensity) was used to indicate the intensity of TIRF staining. A WGA-containing granule was defined by a minimum of a square of 3 × 3 pixels (1 pixel = 0.16 µm) of strong intensity signal (orange to white intensity). Also see Videos 1 and 2. (E) The number of docking events per cell acquired with TIRF microscopy, from 8 min to 15 min of the acquisition. Statistical analyses were performed using unpaired t tests. *, P < 0.05; **, P < 0.005; ***, P < 0.0001. 20 cells were analyzed for each condition in a total of four independent experiments. Error bars represent mean ± SD. Bars, 2 µm.

