
Figure 5.
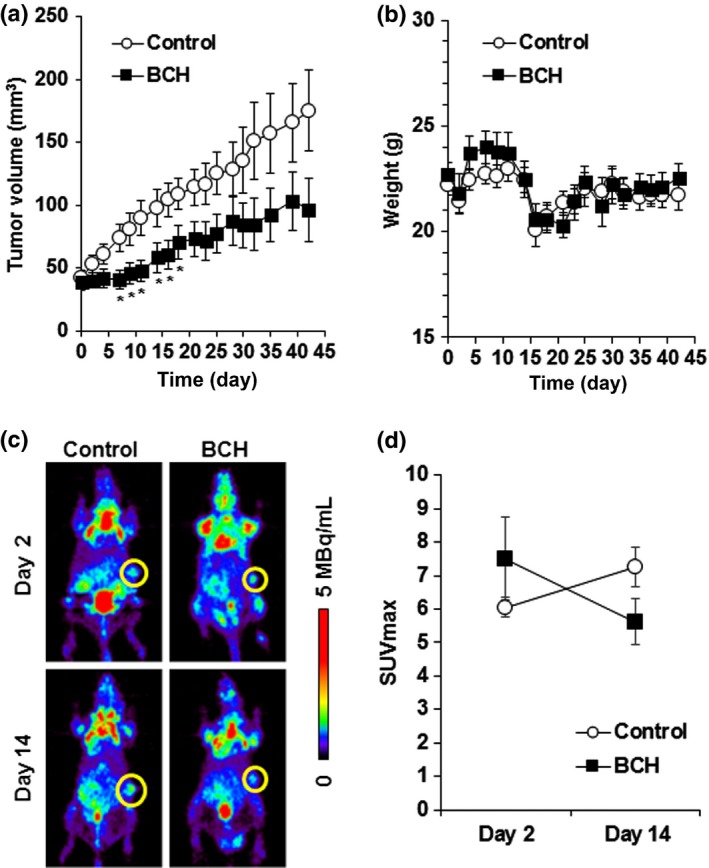
Antitumor effect of 2‐aminobicyclo‐(2,2,1)‐heptane‐2‐carboxylic acid (BCH) on KYSE150 tumor‐xenograft model. (a) Growth curves of KYSE150 tumor after treatment with saline or BCH (n = 10). *Statistically significant difference from control (P < 0.05). (b) Body weight of KYSE150 tumor‐bearing mice after treatment with saline or BCH (n = 10). (c) Representative coronal section of 18F‐FDG‐PET images of KYSE150‐bearing mice at 2 h after 18F‐FDG injection. PET imaging was carried out at indicated days after the day of grouping. Yellow circle shows the tumor. The calibration bar is shown to the right of images. (d) Maximum standardized uptake value (SUVmax) of 18F‐FDG‐PET images at day 2 and day 14 after the day of grouping (n = 4).