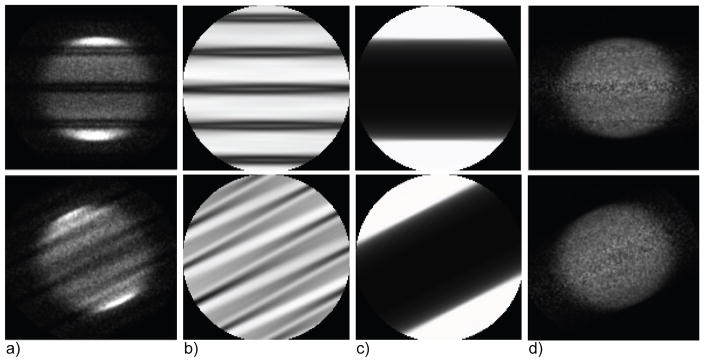
Figure 3.
Measured data and multiplicative corrections in the histo-image format for a 35-cm cylindrical phantom showing the effect of gaps between detector modules (central slices for 2 transverse views out of 40 are shown, each scaled to its maximum, and cropped out of FOV): (a) prompts, (b) detector sensitivity factors (reflecting gaps and LOR sensitivity), (c) attenuation factors, and (d) corrected prompts. The data are from the University of Pennsylvania research (La-PET) TOF-PET system (Daube-Witherspoon et al., 2010), which has 24 detector modules with gaps between modules, each approximately 8 mm wide. Because of the grouping of angles, gaps do not show up as solid dark bands of zero value at regular intervals but as regions of variable, decreased intensity. In this example, the prompts histo-images were simplistically corrected for the gaps by dividing them by the corresponding histo-images with the sensitivity and attenuation factors, thereby providing accurate mean values but also increased noise in the gap regions.

