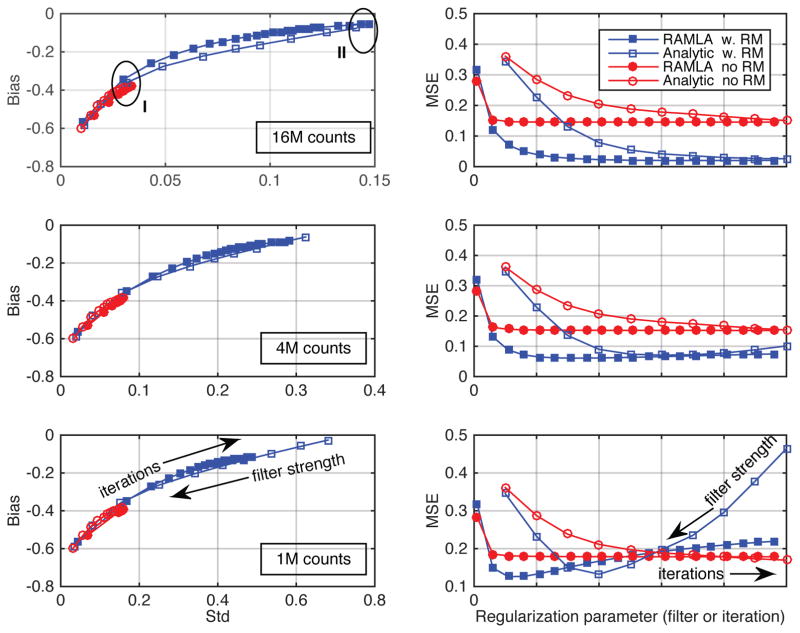
Figure 7.
Comparisons of the (left) bias and standard deviation of mean uptake values and (right) their MSEs for 10-mm spheres located axially ¼ off-center in the simulated phantom for analytic- and iterative-DIRECT, both with and without resolution models (RM). SUV bias-vs.-std results and MSE values are shown for variable levels of regularization using spectral apodizing (Cosine) filters of various strengths (with the cut-off parameter increasing from (left) 0.4 times the Nyquist frequency to (right) no filtering) for analytic-DIRECT and various iteration numbers (5–100, from left to right) for iterative-DIRECT for 16M, 4M, and 1M counts (top to bottom). Areas I and II in the top-left plot correspond to images illustrated in figure 8.

