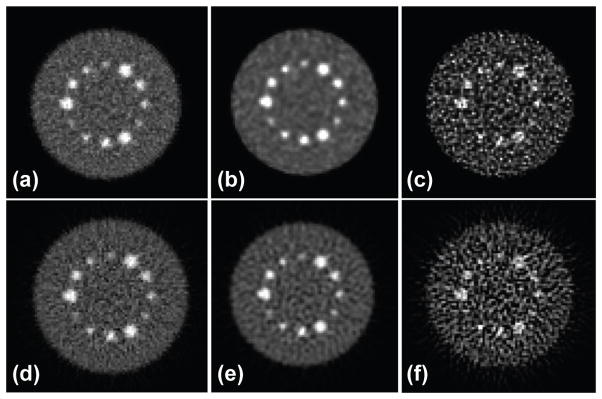
Figure 8.
Central slices of DIRECT reconstructions of 16M-count simulated phantom: Top: iterative RAMLA (a) without RM (near convergence), (b) with RM stopped before convergence – at similar bias and variability (and MSE) levels to non-RM case, and (c) with RM near convergence; Bottom: analytic (d) without RM, (e) with RM and filtering to control noise at similar bias, variability, and MSE to the non-RM case, and (f) with RM and without post-filtering. Each pair of images (top-bottom) has similar bias/variance trade-offs indicated in figure 7 (top-left) by area I for images (a, b, d, e) and by area II for images (c, f).

