
Figure 1.
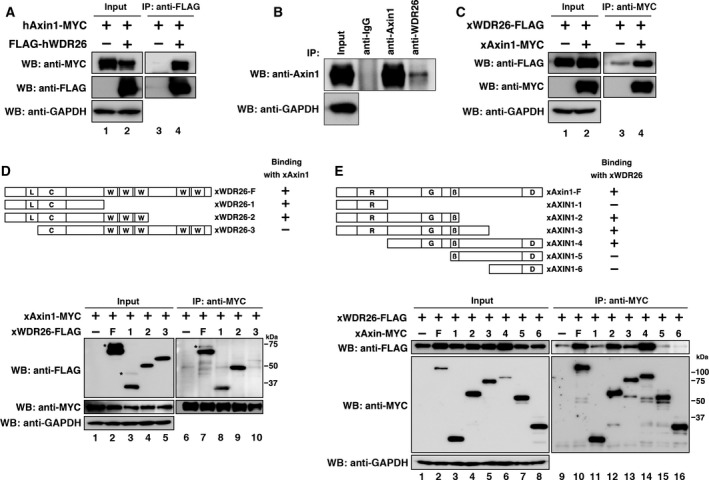
Interaction between WDR26 and Axin1. (A) Interaction between ectopically expressed hWDR26 and hAxin1 in HEK 293T cells. Relative intensity of each western blot was measured by imagej. The ratios of IP/Input of hAxin1 were calculated. Their statistical significances were determined by Mann–Whitney U test. P < 0.01 (between lane 3/lane 1 and lane 4/lane 2). (B) Interaction between endogenous hWDR26 and hAxin1 in HEK 293T cells. Cells were treated with 10 μm MG‐132 for 24 h to improve the detection. The endogenous interaction between hWDR26 and hAxin1was not detected with an anti‐WDR26 antibody (data not shown). (C) Interaction between ectopically expressed xWDR26 and xAxin1 in HEK 293T cells. Relative intensity of each western blot was measured by imagej. The ratios of IP/Input of xWDR26 were calculated. Their statistical significances were determined by Mann–Whitney U test. P < 0.001 (between lane 3/lane 1 and lane 4/lane 2). (D) Interactions among ectopically expressed xAxin1 and truncated xWDR26 constructs. WDR26 protein‐interacting domains are labeled as follows: L: LisH (lis homology domain); C: CTLH (C‐terminal to LisH motif) domain; W: WD40 repeat domain. Asterisks indicate higher molecular weight bands. Constructs were transfected into HEK 293T cells. Relative intensity of each western blot was measured by imagej. The ratios of IP/Input of xWDR26 constructs were calculated. Their statistical significances were determined by Mann–Whitney U test. P > 0.5 (between lane 7/lane 2 and lane 8/lane 3). P > 0.1 (between lane 7/lane 2 and lane 9/lane 4). P < 0.001 (between lane 7/lane 2 and lane 10/lane 5). (E) Interactions among ectopically expressed xWDR26 and truncated xAxin1 constructs. Axin1 protein‐interacting domains are labeled as follows: R: RGS (regulation of G‐protein signaling) domain; G: GSK3‐β binding domain; β: β‐catenin binding domain; D: DIX (Dishevelled and axin) domain. Constructs were transfected into HEK 293T cells. Relative intensity of each western blot was measured by imagej. The ratios of IP/Input of xAxin1 were calculated. Their statistical significances were determined by Mann–Whitney U test. P < 0.01 (between lane 10/lane 2 and lane 11/lane 3). P > 0.5 (between lane 10/lane 2 and lane 12/lane 4). P > 0.05 (between lane 10/lane 2 and lane 13/lane 5). P > 0.1 (between lane 10/lane 2 and lane 14/lane 6). P < 0.01 (between lane 10/lane 2 and lane 15/lane 7). P < 0.01 (between lane 10/lane 2 and lane 16/lane 8).