
Figure 5.
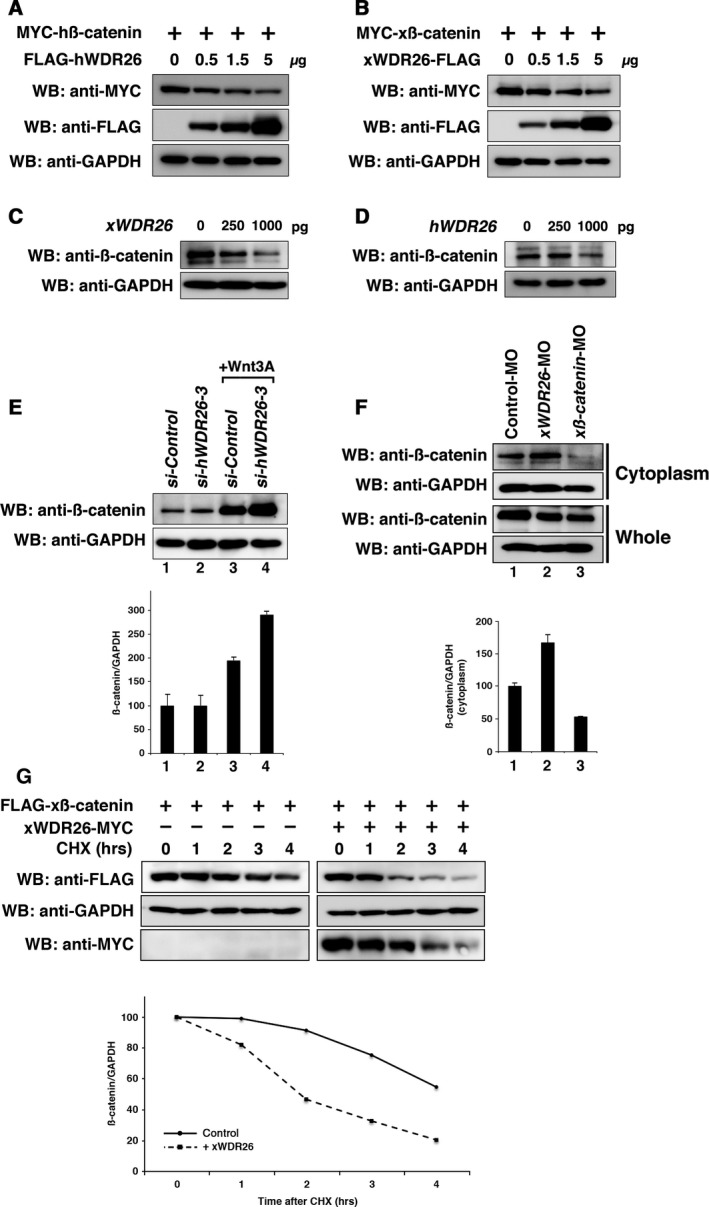
Effects of WDR26 to the stability of β‐catenin. (A–B) Western blotting analysis of ectopically expressed β‐catenin in HEK 293T cells. The amounts of transfected plasmids (hWDR26 and xWDR26) were indicated (0, 0.5, 1.5, 5 μg per dish). GAPDH was used as a loading control. (C–D) Western blotting analysis of endogenous xβ‐catenin in Xenopus embryonic cells. The amounts of injected mRNA (xWDR26 and hWDR26) were indicated (0, 250, 1000 pg per embryo). Cytoplasmic fractions of lysates extracted at the gastrula stage were used here. (E) Western blotting analysis of endogenous hβ‐catenin in HEK 293T cells. si‐hWDR26‐3, an siRNA against hWDR26, was transfected into HEK 293T cells. Twenty‐four hours after transfection, cells were stimulated with Wnt3A for 6 h. Relative intensity of each western blot (upper panel) was measured by imagej. The ratios of IP/Input of hβ‐catenin/hGAPDH were calculated and graphed. The value obtained for each hβ‐catenin signal was normalized to the level of hGAPDH signal. The value of unstimulated control (lane 1) was set to 100, and other values were computed (other lanes). Error bars represent standard deviation of the mean in three experiments. Statistical significances of values among indicated lanes were determined by Mann–Whitney U test. P > 0.1 (between lane 1 and lane 2). P < 0.005 (between lane 1 and lane 3). P < 0.005 (between lane 3 and lane 4). (F) Western blotting analysis of endogenous xβ‐catenin in Xenopus embryonic cells. xWDR26‐MO (40 ng) was injected into animal blastomeres of eight‐cell embryos, and lysates were extracted at the gastrula stage. xβ‐catenin‐MO was used as a positive control. Relative intensity of each western blot (upper panel) was measured by imagej. The ratios of IP/Input of xβ‐catenin/xGAPDH were calculated and graphed (bottom panel). The value for Control‐MO‐injected embryos (lane 1) was set to 100, and other values were computed (other lanes). Error bars represent standard deviation of the mean in three experiments. Statistical significances of values among indicated lanes were determined by Mann–Whitney U test. P < 0.01 (between lane 1 and lane 2). P < 0.01 (between lane 1 and lane 3). (G) Western blotting analysis of the stability of β‐catenin in HEK 293T cells. xWDR26 was transfected at 24 h after transfection of xβ‐catenin. Five hours after the transfection xWDR26, cells were stimulated with cycloheximide (CHX) (20 mg·mL−1) during indicated hours. We measured relative intensity of each western blot (upper panel) by imagej, calculated the ratios of β‐catenin/GAPDH, and graphed (bottom panel). The value for cells untreated with cyclohexmide was set to 100, and other values were computed (other lanes). Solid line indicates ratios of β‐catenin/GAPDH (left panels) as control. Dotted line indicates ratios of β‐catenin/GAPDH with xWDR26 transfection (right panels).