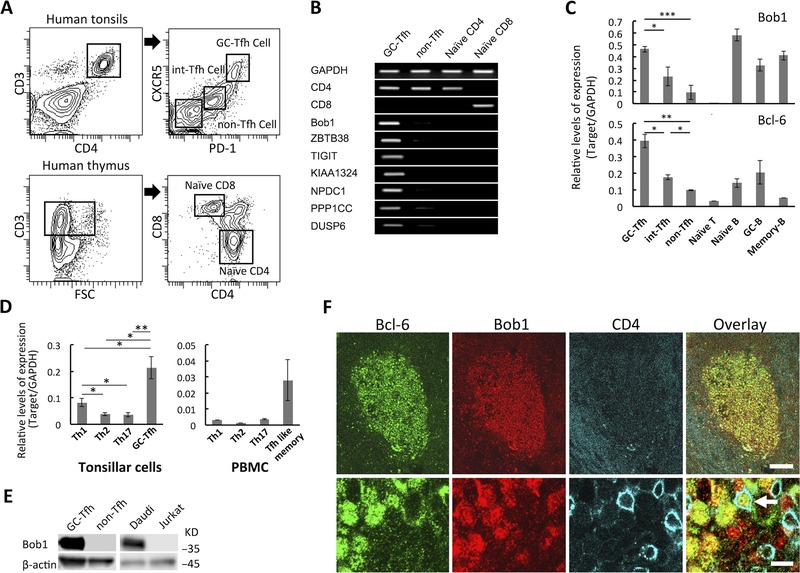
Figure 1.

Expression of Bob1 in human Tfh cells. (A) GC‐Tfh cells (CD3+CD4+CXCR5hiPD‐1hi), int‐Tfh cells (CD3+CD4+CXCR5intPD‐1int), and non‐Tfh cells (CD3+CD4+CXCR5−PD‐1−) were purified from human tonsils with a cell sorter (upper panels) (Supporting Information Fig. 1A), and the identity of each population was further examined by ICOS expression (Supporting Information Fig. 1B). Naïve CD4+ T cells (CD3+CD4+CD8−) and CD8+ T cells (CD3+CD4−CD8+) were sorted from the thymus (lower panels). Each gate of isolated lymphocytes is depicted. Data shown are from a single experiment representative of three independent experiments, with one tonsil sample per experiment. (B) Highly expressed genes of Tfh cells as detected by microarray analysis were assessed by RT‐PCR analysis. Data shown are from a single experiment representative of three independent experiments with one tonsil sample per experiment. (C) The gene transcripts of Bob1 and Bcl‐6 in GC‐Tfh, int‐Tfh, and non‐Tfh cells of human tonsils were quantified by quantitative RT‐PCR analysis and compared with those in naïve B cells (CD3−CD19+CD27−CD38−), GC B cells (CD3−CD19+CD27+CD38+), and memory B cells (CD3−CD19+CD27+CD38−). Three B‐cell subsets were sorted from human tonsils (Supporting Information Fig. 2). (D) Quantitative RT‐PCR analysis of Bob1 expression in Th subsets including Th1 cells (CD3+CD4+CXCR5−CCR5+), Th2 cells (CD3+CD4+CXCR5−CCR4+CCR8+), Th17 cells (CD3+CD4+CXCR5−CCR6+CD161+), and Tfh‐like memory cells (CD3+CD4+CXCR5+) isolated from human tonsils or peripheral blood. Each subset was purified by a cell sorter (Supporting Information Fig. 3A and B). (C, D) Data are presented as ratios of target genes and GAPDH mRNA expression. Data are shown as mean ± SD of results pooled from three independent experiments. (E) Bob1 expression in Tfh cells was examined at the protein level. Whole cell extracts from tonsillar Tfh cells and non‐Tfh cells were subjected to Western blot analysis with a specific antibody against Bob1. An anti‐β‐actin antibody was used for the loading control. Daudi B cells and Jurkat T cells were also examined as positive and negative controls, respectively. Data shown are from a single experiment and are representative of three independent experiments with one tonsil sample per experiment. (F) Localization of Bob1+CD4+ T cells in GCs of lymphoid follicles of human tonsils. After staining of frozen tissue sections of tonsils, signals were detected by laser confocal microscopy. Bcl6+ (green), Bob1+ (red), and CD4+ (cyan) cells as indicated by arrows are thought to be GC‐Tfh cells. Upper panels: original magnification, 100× (scale bar, 100 μm). Lower panels: original magnification, 400× (scale bar, 10 μm). Images are from a single experiment representative of three independent experiments. *p < 0.05, **p < 0.01, ***p < 0.005; NS, not significant (p > 0.05); unpaired Student's t‐test.
