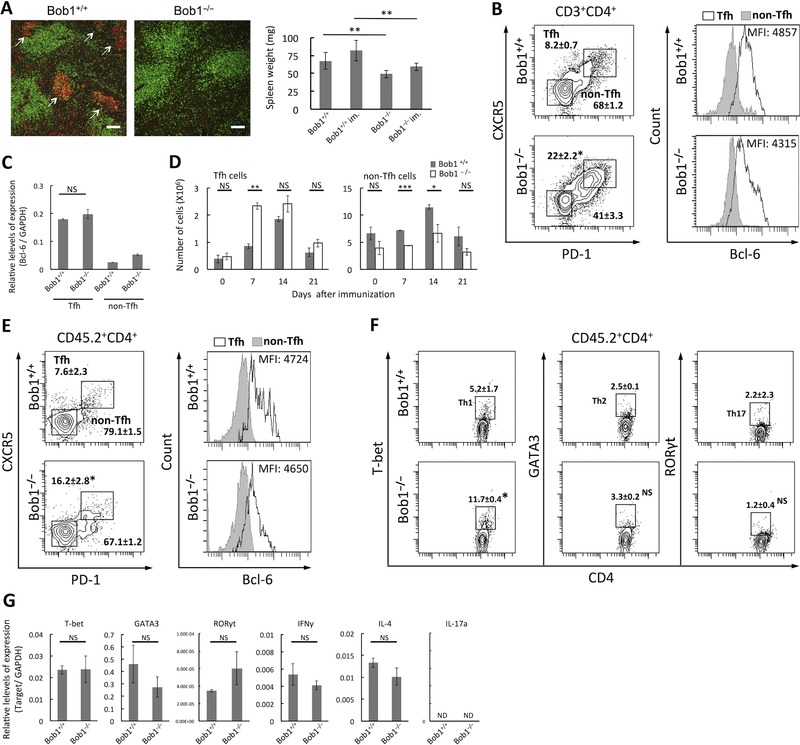
Figure 3.

Tfh cells in Bob1‐deficient mice. (A) Formation of GCs in spleens of Bob1+/+ (left panel) and Bob1−/−(middle panel) mice at day 7 after immunization with SRBCs and their weights in immunized (im) and nonimmunized states. After double staining of frozen tissue sections of spleens with PNA (red) and anti‐CD3 (green), signals were detected by an immunofluorescence microscope. Arrows indicate GCs. Original magnification 100× (scale bar: 100 μm). Images are representative of three independent experiments with one mouse per experiment. (B) Percentages of Tfh cells (CD3+CD4+CXCR5+PD‐1+) and non‐Tfh cells (CD3+CD4+CXCR5−PD‐1−) per total CD4+ T cells of spleens of Bob1+/+ and Bob1−/− (left panel). CD4+ T cells gated by positive staining for CD3 and CD4 were examined for CXCR5 and PD‐1 expression (Supporting Information Fig. 5A). The identity of each population was further investigated by FACS analysis to detect intracellular Bcl‐6 expression as depicted in histograms. The values in the plots represent the percent of the population within CD3+CD4+ cells as mean ± SD of samples pooled from three to five independent experiments with one mouse per experiment. (C) Quantitative RT‐PCR analysis of Bcl‐6 in Tfh cells of Bob1+/+ and Bob1−/− mice in (A). The data represent relative levels of expression compared with those of Bob1+/+ Tfh cells after normalizing to GAPDH expression. (D) Absolute numbers of Tfh cells and non‐Tfh cells in spleens of Bob1+/+ and Bob1−/− mice as studied in (A). (E) Percentages of Tfh cells and non‐Tfh cells per total CD4+ T cells of Bob1+/+ and Bob1−/− mice (CD45.2) in primed WT mice (CD45.1). Total CD4+ T cells were isolated from spleen cells of Bob1+/+ and Bob1−/− mice (CD45.2) and adoptively transferred into Ly5.1 WT mice (CD45.1) 24 h before immunization. At day 7 after immunization with SRBCs, donor T cells in recipient spleens were identified by positive staining for both CD45.2 and CD4 (Supporting Information Fig. 5B), and their Tfh‐cell phenotype and Bcl‐6 were analyzed as in (B). The numbers represent the percent of the population within CD45.2+CD4+ cells as mean ± SD. (F) Percentages of Th subsets including Th1, Th2, and Th17 cells per total CD4+ T cells of Bob1+/+ and Bob1−/− mice (CD45.2) in primed WT mice (CD45.1). CD45.2+CD4+ T cells shown in Supporting Information Fig. 5B were subjected to intracellular FACS analysis for detecting T‐bet (Th1 cells), GATA3 (Th2 cells), and RORγt (Th17 cells). The numbers represent the percent of the population within CD45.2+CD4+ cells and are shown as mean and ± SD. (G) Quantitative RT‐PCR analysis of transcription factors and cytokines characteristic of Th1 (T‐bet and IFN‐γ), Th2 (GATA3 and IL‐4), and Th17 cells (RORγt and IL‐17) in total CD4+ T cells of Bob1+/+ and Bob1−/− mice (CD45.2) in primed WT mice (CD45.1). CD45.2+CD4+ cells shown in Supporting Information Fig. 5B were isolated with a cell sorter and used for the experiments. Data are presented as relative levels of expression after normalizing with GAPDH expression. (A, C, D, and G) Data are shown as mean ± SD of results pooled from three independent experiments, each performed with cells pooled from three spleens per experiment. (B, E, and F) Flow cytometry data are representative of three to five independent experiments with one mouse per experiment. *p < 0.05, **p < 0.01, ***p < 0.005; NS, not significant (p > 0.05); unpaired Student's t‐test.
