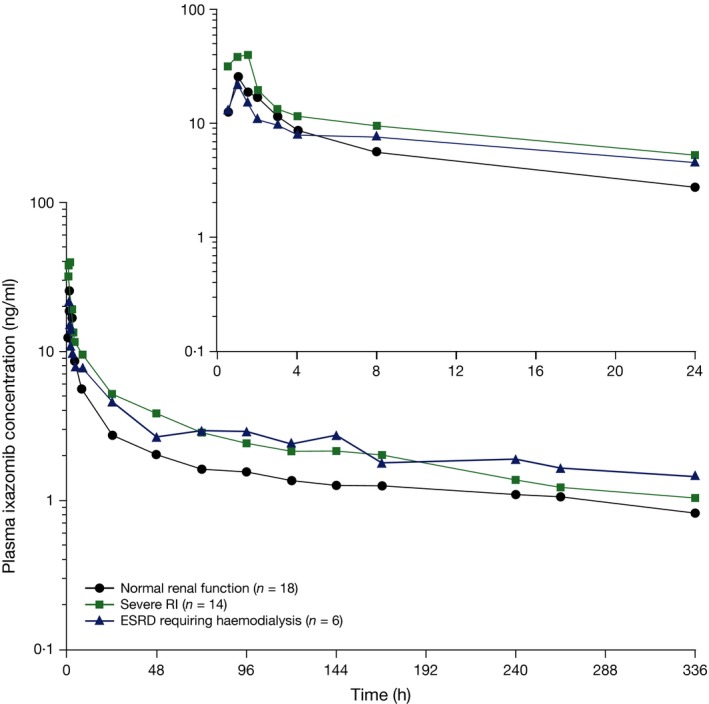
Figure 2.

Mean plasma ixazomib concentration–time plots. Mean plasma ixazomib concentration‐time plots after oral administration of 3 mg ixazomib in Part A of the study in patients with normal renal function, severe RI and ESRD requiring haemodialysis (log‐linear scale). The inset shows the mean plasma ixazomib concentrations of the first 24 h post‐dose. ESRD, end stage renal disease requiring haemodialysis; RI, renal impairment.
