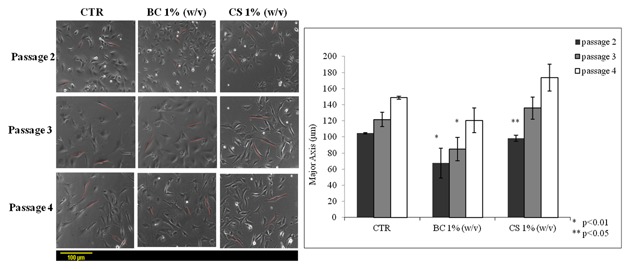
Figure 2.

Comparative cell dimensions analysis relative to major axis between chondrocytes cultured a three different passages (p2, p3, p4) in presence of biotechnological chondroitin (BC 1% w/v) and chondroitin sulfate (CS 1% w/v) after 7 days of treatment. The data represent mean ± SD of three independent experiments. The groups (BC at passage 2 and 3 respect to control) are significantly different according to Student's t‐test (*P < 0.01) and (CS passage 2 respect to control) (**P < 0.05).
