
Figure 3.
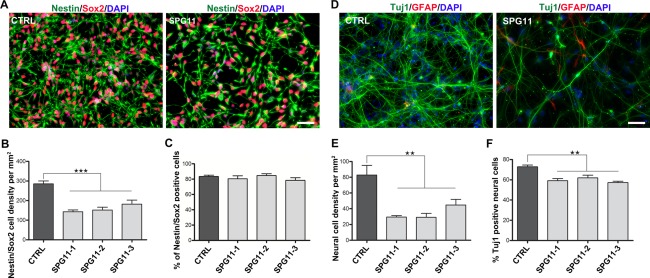
Reduced proliferation and neurogenesis in SPG11‐NPCs. (A) Representative images of Nestin/Sox2 double‐positive NPCs generated from SPG11- and CTRL-iPSCs. Nuclei were visualized with DAPI. Scale bar = 50µm. (B) SPG11‐NPCs exhibit a decreased Nestin/Sox2 cell density compared to CTRL-NPCs. (C) No difference in Nestin/Sox2 double‐positive cells (% over DAPI) between SPG11- and CTRL-NPC lines. (D) Differentiated neuronal cells expressing neuron‐specific (Tuj1) and glia‐specific (GFAP) markers. Nuclei were visualized with DAPI. Scale bar = 50µm. (E) SPG11‐NPCs exhibit a marked reduction in neuronal cell density compared to CTRL. (F) SPG11‐NPCs show reduced generation of Tuj1‐positive neurons compared to CTRL-NPCs, reflecting neurogenesis deficits in SPG11 patients. Data are represented as mean ± SEM. **p < 0.01; ***p < 0.001, by one‐way ANOVA followed by Dunnett's post‐hoc multiple comparison test (B, C, E, F). ANOVA = analysis of variance; DAPI = 4’,6‐diamidino‐2‐phenylindole; GFAP = glial fibrillary acidic protein; iPSCs = induced pluripotent stem cells; NPCs = cortical neural progenitor cells.