
Figure 2.
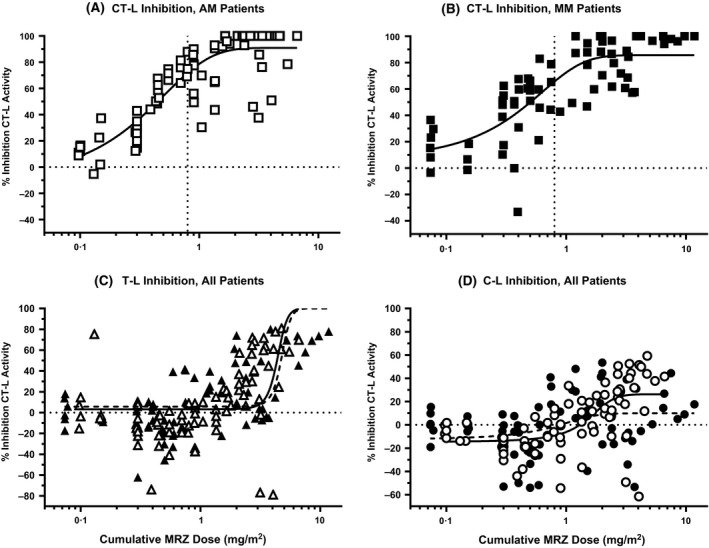
Cumulative effect of MRZ infusion on (A and B) CT‐L, (C) T‐L and (D) C‐L activity in PWB after repeated infusion. (A) CT‐L inhibition in Arm AM patients, (B) CT‐L inhibition in Arm MM patients; curves denote the nonlinear fit (log MRZ dose vs response, three parameters), dotted vertical lines denote the dose level estimated to induce 50% inhibition of CT‐L activity (0·3 mg/m2 for Arm AM, 0·8 mg/m2 for Arm MM). (C) T‐L inhibition, (D) C‐L inhibition; treatment effects are depicted in AM (open symbols) or MM (closed symbols) patients. Curves denote the nonlinear fit (log MRZ dose vs response, three parameters): solid line, AM patients; dashed line, MM patients. MRZ, marizomib; CT‐L, chymotrypsin‐like; T‐L, trypsin‐like; C‐L, caspase‐like; PWB, packed whole blood; AM, advanced malignancies; MM, multiple myeloma.