
Figure 2.
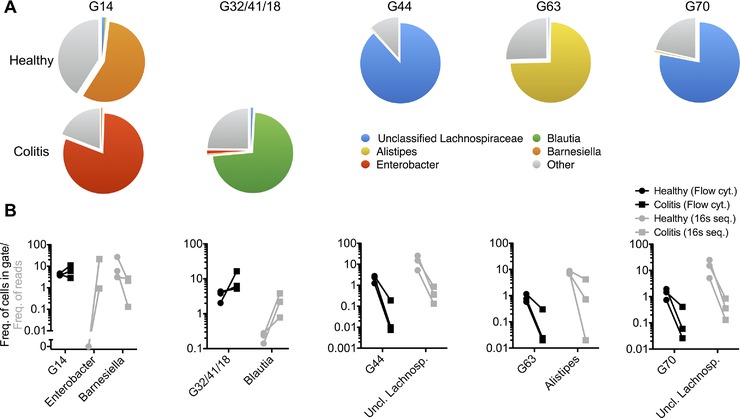
Electronic gates comprise distinct bacterial phyla. Bacteria were sorted by FACS from the feces of n = 3 individual mice before and/or after the onset of T‐cell transfer‐induced colitis. Isolated DNA was analyzed by next‐generation sequencing and classified with the Ribosomal Database Project (RDP) as specified in the Materials and methods provided in the supplemental information. (A) 16s rDNA sequence analysis of flow‐sorted populations of fecal bacteria from n = 3 individual mice (same individuals as for Supporting Information Fig. 4) before and/or after the onset of T‐cell transfer colitis. Depicted is the phylogenetic composition of the gates as median frequencies of bacterial taxa that make up ≥ 50% of at least one of the sorted populations. (See Supporting Information Fig. 6 for detailed composition) (B) Frequencies of events in cytometric gates (black symbols) and corresponding frequencies of 16s rDNA reads (gray symbols) for the taxa identified in (A) in n = 3 individual healthy mice (filled circles) and after the onset of colitis (filled rectangles).