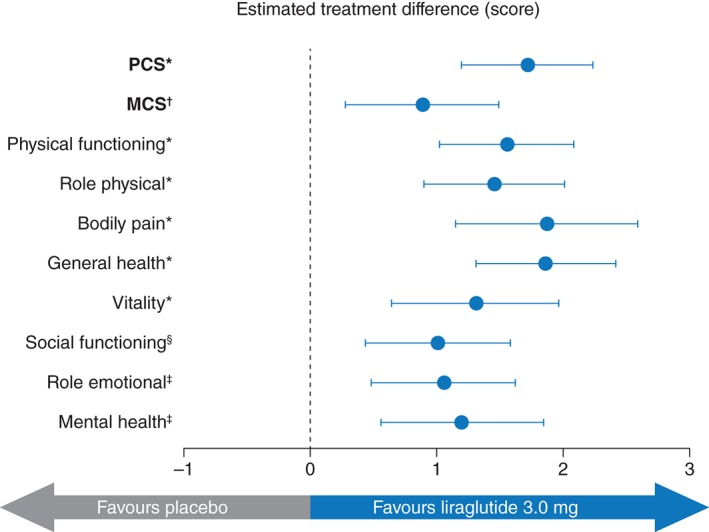
Figure 3.

SF‐36 estimated treatment difference for PCS and MCS and subscale scores at Week 56. Data are estimated treatment difference and 95% confidence intervals. *P < 0.0001, † P = 0.0034, ‡ P = 0.0002, § P = 0.0004. MCS, mental component summary; PCS, physical component summary; SF‐36, Short‐Form 36.
