Figure 2.

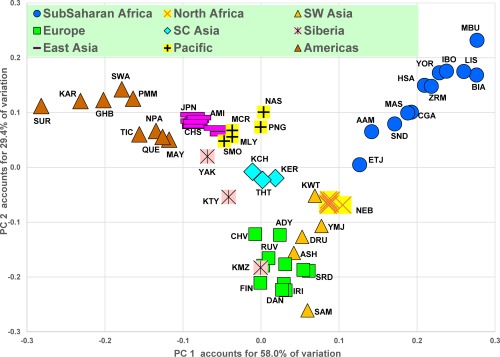
Principal components analysis. Plot of results for first two principal components. PCA is based on pairwise Tau genetic distances for 65 populations.

Principal components analysis. Plot of results for first two principal components. PCA is based on pairwise Tau genetic distances for 65 populations.