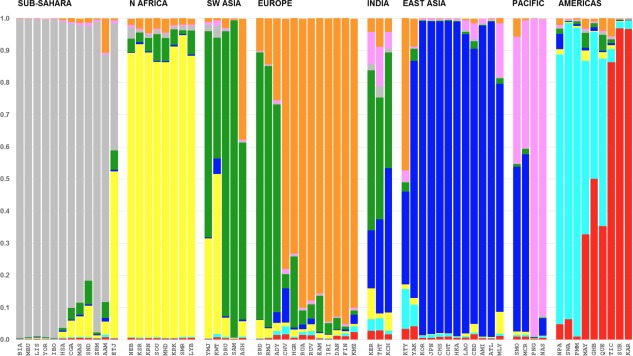
Figure 4.

STRUCTURE population bar plot showing average estimated cluster membership in each of 65 populations for the runs with highest likelihood out of 20 runs for cluster K = 8. There are 65 population bars and each population bar has the same width. The height extent of each color within a population bar corresponds to the average estimated cluster membership for all the individuals in the population.
