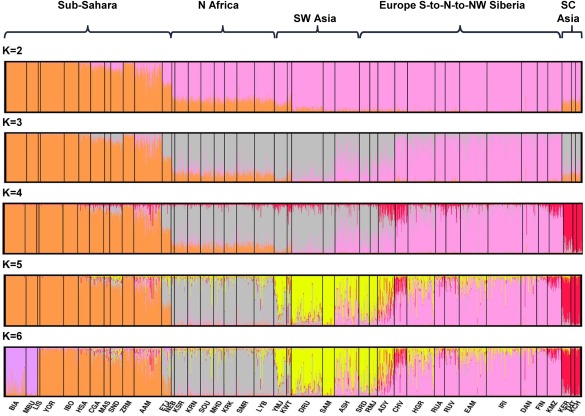
Figure 5.

STRUCTURE individual bar plots—40 populations, 299 markers study—displaying results for the most common cluster pattern out of 20 runs in each cluster for K = 2–6. This analysis omits the 25 populations from East Asia, the Pacific, and the Americas. The highest likelihood run in this more focused analysis is usually found among the runs of the most common cluster pattern.
