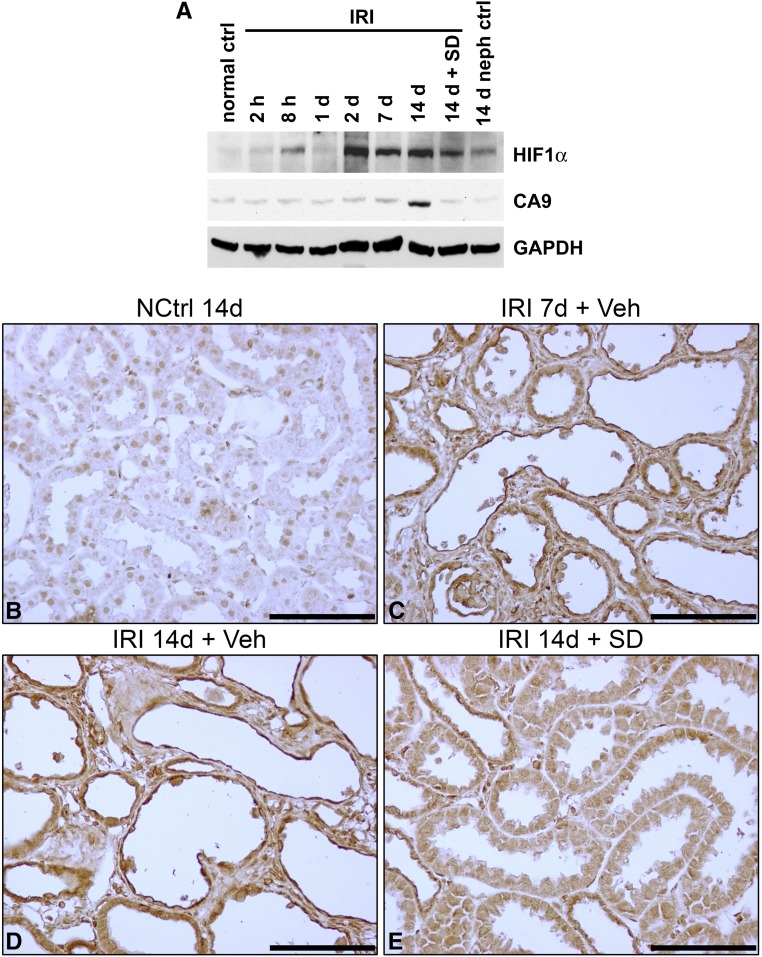
Figure 2.
Expression of hypoxia markers after IRI. (A) Western blotting of kidney lysates for HIF1α and CA9 in normal control, 14-day nephrectomy sham left kidney ischemia control, kidneys at serial time intervals up to 14 days of IRI, and kidney 14 days after IRI with SD208 treatment. In this blot, CA9 appears increased only after 14 days of IRI. A separate series of experiments (n=3) showed significant increases at 3, 7, and 14 days after IRI (not shown). (B–E) IHC for CA9 in nephrectomy control, kidneys 7 and 14 days after IRI, and SD208-treated kidney 14 days after IRI. (B) Compared with the time control 14 days after nephrectomy (NCtrl 14d), there is marked increase of staining for CA9 in (C) regenerating tubules (with flat epithelium) and fibroblasts proliferating in markedly widened interstitium of kidneys of rats treated with vehicle only 7 days after IRI (IRI 7d + Veh) and (D) flat atrophic epithelium of tubules in a fibrotic area of rat kidney treated with vehicle only 14 days after IRI (IRI 14d + Veh). The corresponding staining of kidney tubules from kidneys of rats treated with SD208 14 days after IRI (IRI 14d + SD) in (E) is reduced only modestly. These IHC findings are representative of a series of four separate experiments. ctrl, Control; GAPDH, glyceraldehyde-3-phosphate dehydrogenase; NCtrl, nephrectomized control; neph, nephrectomy; Veh, vehicle. Scale bar, 100 μm.

