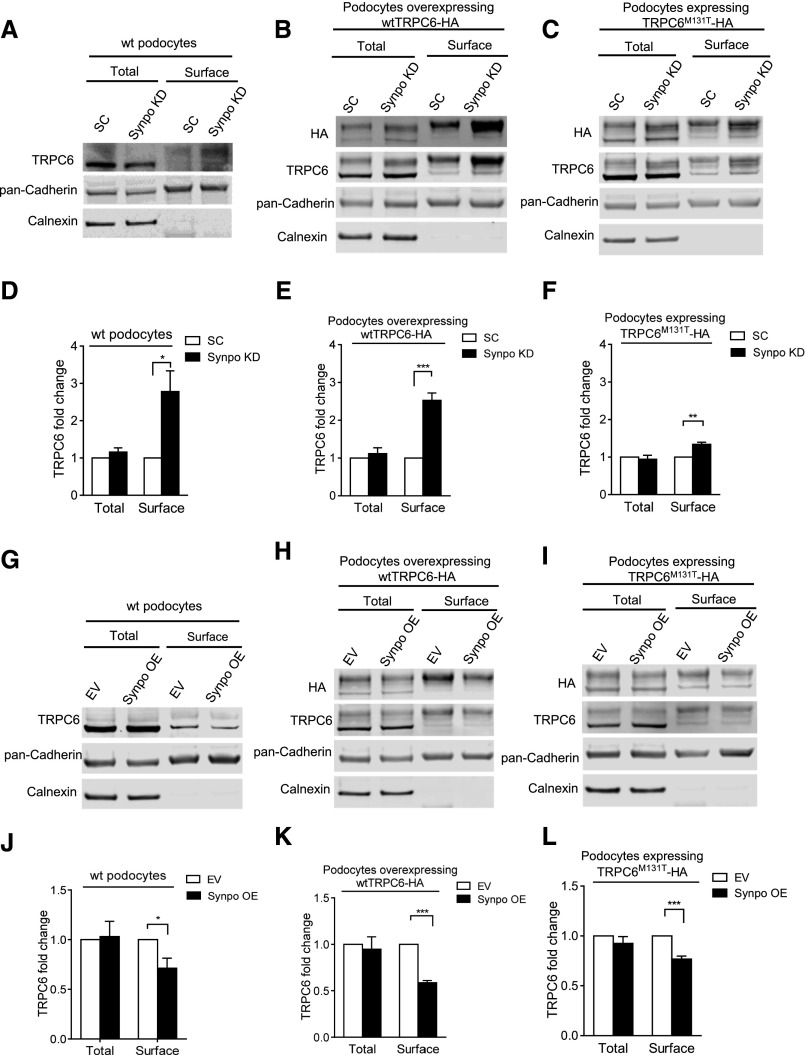
Figure 2.
Surface biotinylation assays show the effects of synaptopodin expression on cell surface TRPC6 levels. Representative Western blots of surface biotinylation assays and quantifications of TRPC6 levels in (A and D) SC and SynpoKD podocytes (n=5), (B and E) SC-wtTRPC6 and SynpoKD-wtTRPC6 podocytes (n=4), (C and F) SC-TRPC6M131T and SynpoKD-TRPC6M131T podocytes (n=4), (G and J) EV and SynpoOE podocytes (n=3), (H and K) EV-wtTRPC6 and SynpoOE-wtTRPC6 podocytes (n=4), and (I and L) EV-TRPC6M131T and SynpoOE-TRPC6M131T podocytes (n=4). Extra bands above the endogenous TRPC6 band in wtTRPC6-HA– and TRPC6M131T-HA–overexpressing podocyte lysates (Supplemental Figure 3B) were confirmed to be glycosylated forms of TRPC630,35 and used in quantification of TRPC6 intensity in addition to the endogenous TRPC6 band. Pan–Cadherin protein levels remained unchanged in SynpoKD– and SynpoOE– or wtTRPC6– and TRPC6M131T–overexpressing podocytes (Supplemental Figures 2, B and D and 3A); therefore, they were used as loading controls for total and surface fractions. ER protein calnexin served as an indicator of the purity of the cell surface fraction. Note that the glycosylated forms (upper bands) of TRPC6 appear more prominent in cell surface fraction, indicating that the glycosylated TRPC6 was enriched. GraphPad Software’s multiple t tests were used for statistical analysis. Graphs represent mean±SEM. *P<0.05; **P<0.01; ***P<0.001.

