Figure 6.
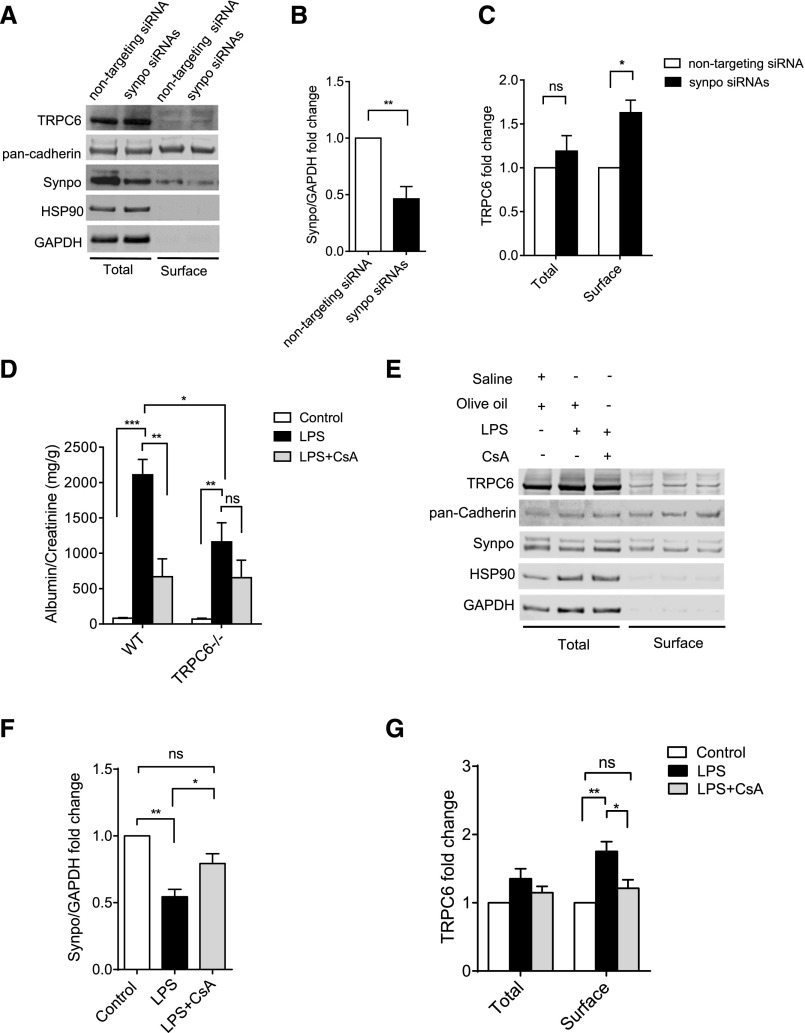
In vivo knockdown of synaptopodin leads to increased podocyte surface TRPC6, and CsA reduces podocyte surface TRPC6 of LPS-treated mice. (A) Representative Western blots showing TRPC6 and synaptopodin in total and surface fractions of enriched podocytes from nontargeting siRNA– and Synpo siRNA–injected mice. pan-Cadherin was used as loading control. HSP90 (heat shock protein 90) was used to indicate the purity of surface fraction. Synaptopodin was seen in the surface fraction, possibly because of its interaction with TRPC6 and other proteins on the plasma membrane, such as podocin and nephrin. (B) Synaptopodin expression was normalized to glyceraldehyde-3-phosphate dehydrogenase (GAPDH) in total cell lysates. (C) TRPC6 levels were normalized to pan-Cadherin, and fold changes were calculated by comparing TRPC6 levels of Synpo siRNAs mice with those of nontargeting mice in the same fraction. The in vivo knockdown experiment (four to five mice in each group) was performed three times for quantification of the protein levels; t tests and GraphPad Software’s multiple t tests were performed in the experiments shown in B and C. (D) Urinary albumin (milligrams)-to-creatinine (grams) ratios in wt and TRPC6−/− mice with LPS and/or CsA treatment. Albumin and creatinine levels were measured from urine samples taken 36 hours after LPS injection (Supplemental Figure 9B). Control mice were injected with saline and olive oil, LPS mice were injected with LPS and olive oil, and LPS+CsA mice were injected with LPS and CsA; six to nine mice were used in each group. Ordinary one–way ANOVA was performed to analyze proteinuria within wt or TRPC6 mice; multiple t tests were performed to compare proteinuria between wt and TRPC6−/− mice. (E) Representative Western blots showing TRPC6 and synaptopodin in total and surface fractions of isolated podocytes from LPS or LPS and CsA–treated mice. (F) Synaptopodin expression was normalized to GAPDH in total cell lysates. (G) TRPC6 levels were normalized to pan-Cadherin, and fold changes were calculated by comparing TRPC6 levels of LPS and LPS and CsA to that of the control in the same fraction. The LPS and CsA treatment (three mice in each group) for the surface biotinylation assays was performed three times for quantification of the protein levels. Ordinary one–way ANOVA was performed in F and G. Graphs represent mean±SEM. *P<0.05; **P<0.01; ***P<0.001.

