Figure 5.
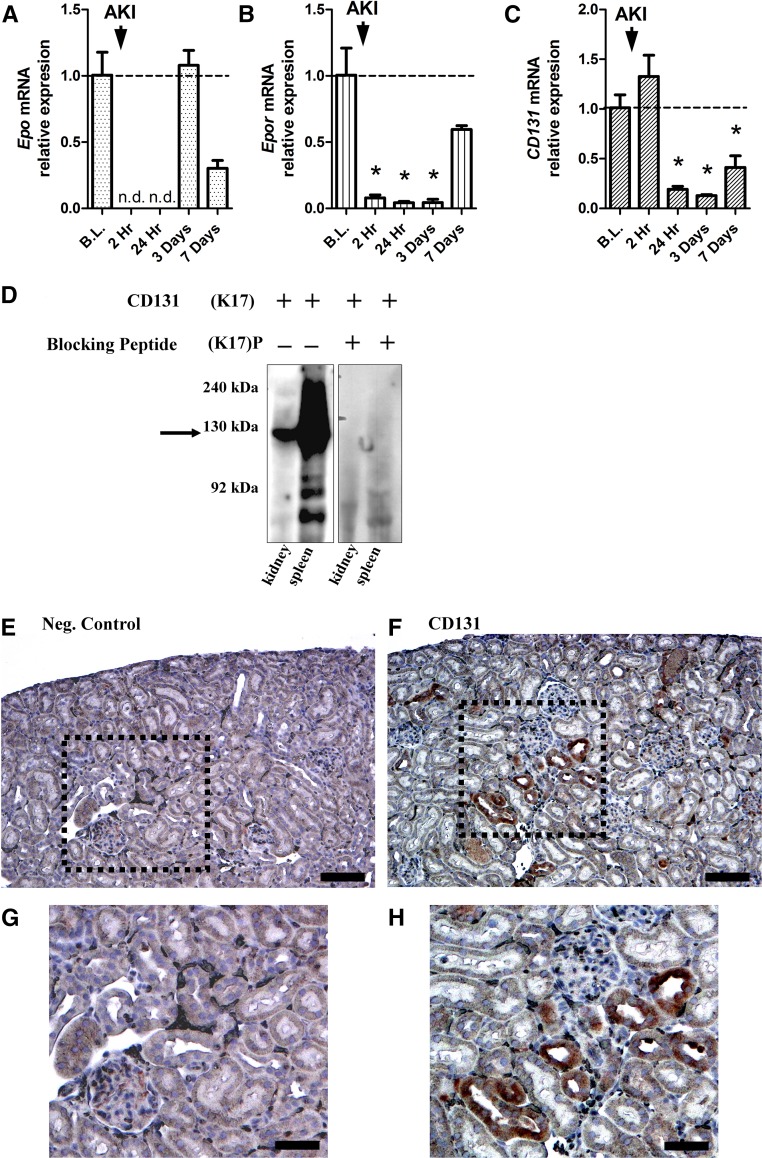
CD131 is expressed in the kidney. (A) In adult female Fisher rats, quantitative RT-PCR analysis of renal tissue at several time points after AKI showed that Epo mRNA levels were detectable in baseline (B.L.) controls (dashed line), dropped below detectable levels after AKI, and returned to baseline levels at 3 and 7 days post-AKI. (B) Epor mRNA levels fell below baseline levels at 2 and 24 hours and 3 days after AKI, and then, they returned toward baseline levels on day 7. (C) CD131 mRNA levels decreased and remained below baseline levels at 24 hours and 3 days, with a small but insignificant increase 7 days after AKI. *P<0.05 compared with the baseline control. (D) A Western blot for CD131 showed high expression in kidney and spleen tissues but not in the presence of a CD131–specific blocking peptide. CD131 has a molecular mass of approximately 130 kD (black arrow). Immunohistochemistry of kidney tissue showing (E) a negative control (Neg. Control) and (F) staining with CD131. (G) A magnified view of the area in the black box from E shows the negative control. (H) A magnified view of the area in the black box from F shows intensive CD131 staining of proximal tubular cells. n.d., not detectable. Scale bars, 100 μm in E and F; 200 μm in G and H.

