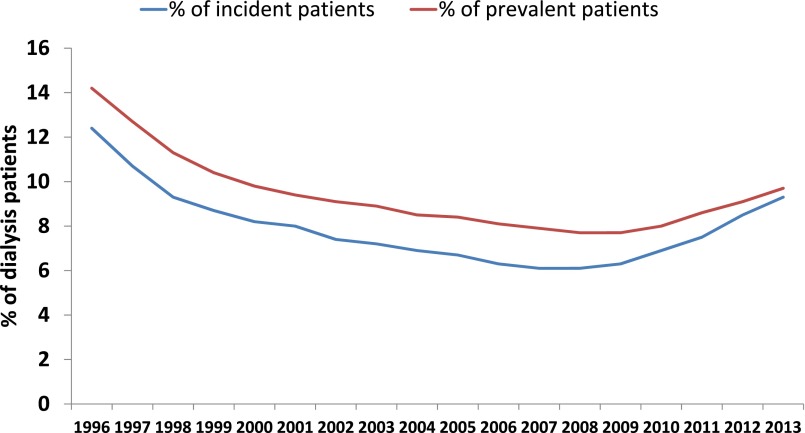
Figure 3.
Secular trends in the proportion of patients undergoing maintenance dialysis treated with PD in the United States (1996–2013). The blue line represents the proportion of all patients undergoing maintenance dialysis treated with PD 90 days from the date of first dialysis and the red line represents the proportion of all patients undergoing maintenance dialysis on December 31 of any calendar year.

