
Figure 4.
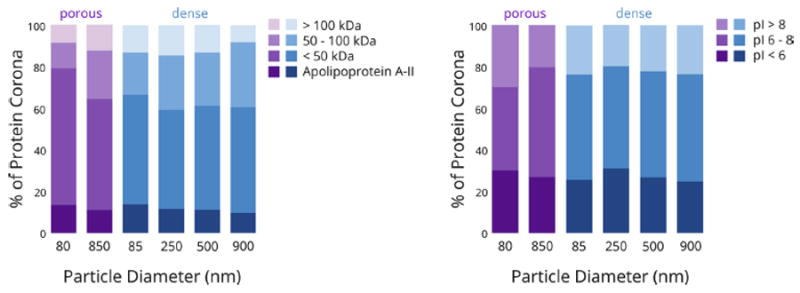
Comparison of the weight percent of the protein corona (NSpC × TGA) across dense and porous particles with different diameters, with respect to (left panel) molecular weight; (right panel) isoelectric point.
Official websites use .gov
A
.gov website belongs to an official
government organization in the United States.
Secure .gov websites use HTTPS
A lock (
) or https:// means you've safely
connected to the .gov website. Share sensitive
information only on official, secure websites.
Comparison of the weight percent of the protein corona (NSpC × TGA) across dense and porous particles with different diameters, with respect to (left panel) molecular weight; (right panel) isoelectric point.