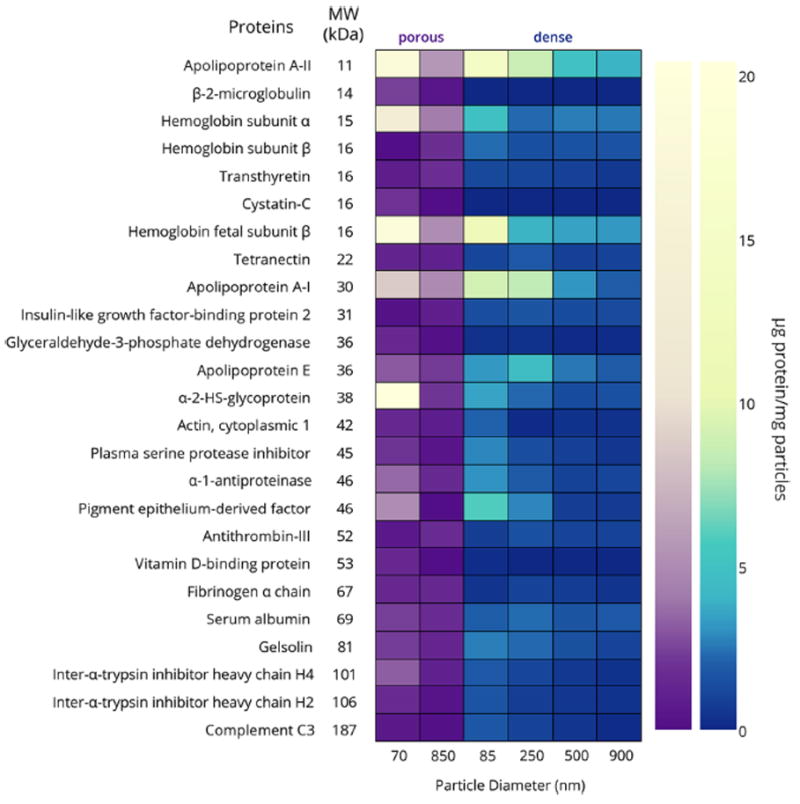
Figure 5.

Heat map illustrating the differences in protein corona composition of porous and dense silica particles. Only proteins with concentrations greater than 1.5 μg/mg particles are included. Note that the color gradients are nonlinear to facilitate observation of proteins present in small amounts. A table of μg protein/mg particles for all identified proteins can be found in the Supporting Information.
