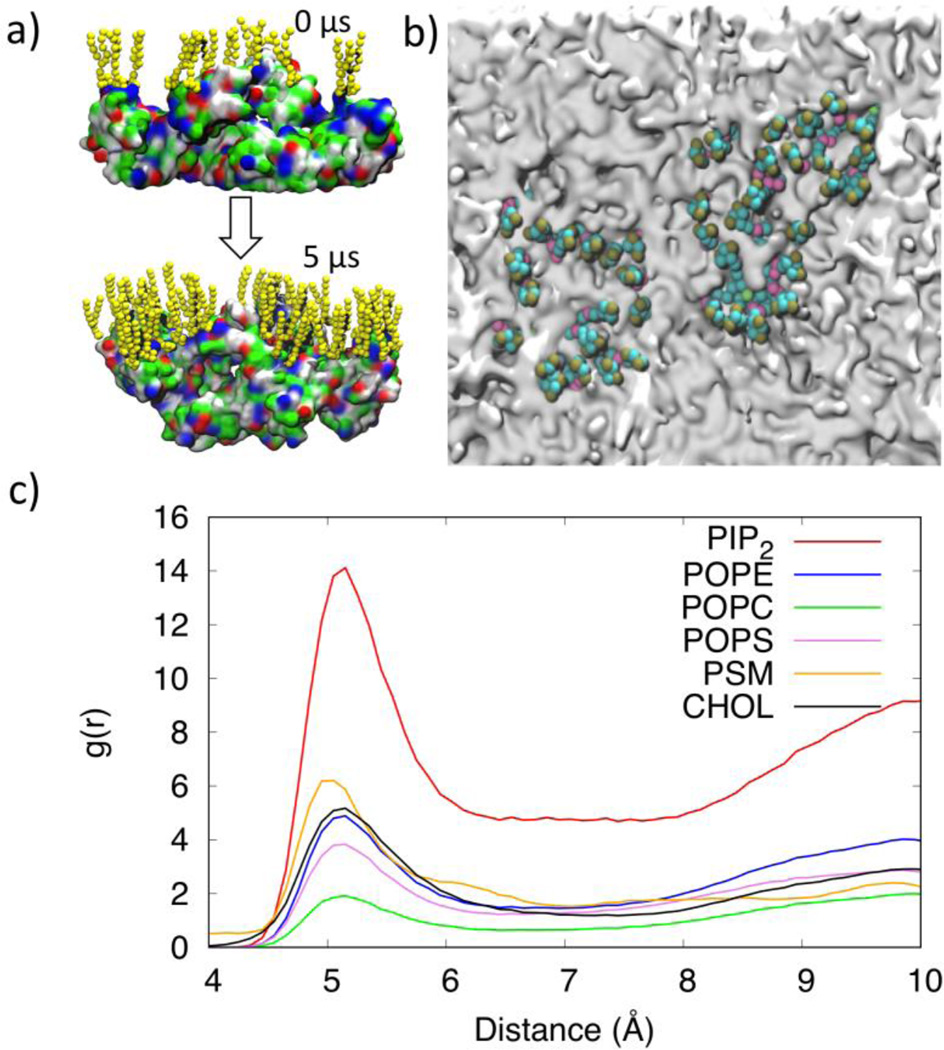
Figure 4.
a) Distribution of the PIP2 lipids near the VP40 hexamer at 0 µs and 5 µs showing the negatively charged lipid head groups interacting with the positively charged or polar residues on the protein. b) Clustering of PIP2 lipids within 7Å of VP40. The VP40 was present in the simulation but is removed from the image to allow full view of the membrane. PIP2 molecules cluster around gray regions that are the location of the VP40 CTDs. c) Radial pair distribution functions for various lipid types relative to the VP40 hexamer.

