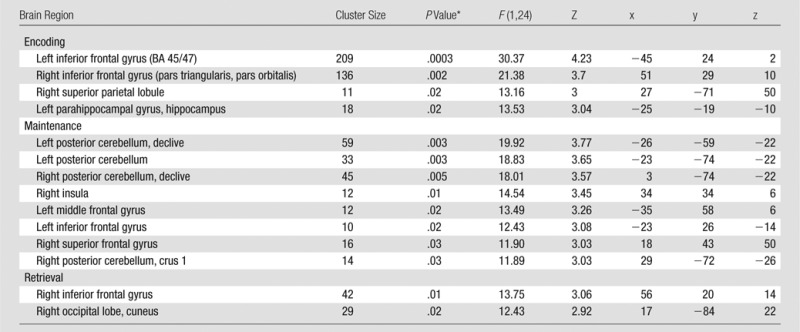
Table 3.
Brain Regions with Increased Functional MR imaging Drug × Time during the Delayed Match-to-Sample Task in the Methylene Blue Group Relative to Baseline and the Placebo Group

Note.—n = 26, with 24 degree of freedom. Uncorrected P < .005. Montreal Neurological Institute, K ≥ 10 (1.719 × 1.719 × 4 mm3 per voxel).
*Small-volume cluster-corrected, family wise error (P < .05).
