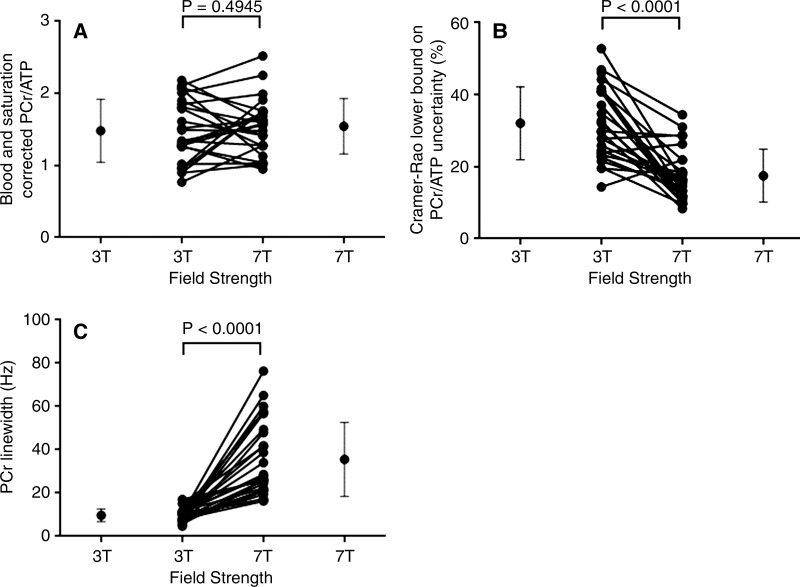
Figure 1:
A, Graph shows PCR/ATP for each patient with DCM (mean age, 54 years ± 12; 68% men; further details in Table 1) at 3 T compared with that at 7 T. B, Graph shows Cramér-Rao lower bounds for each patient with DCM at 3 T compared with that at 7 T. C, Graph shows linewidth for PCr in hertz at 3 T compared with that at 7 T for each patient with DCM. Error bars at sides mark mean and standard deviation. In center, each connected pair of points shows data for one patient.

