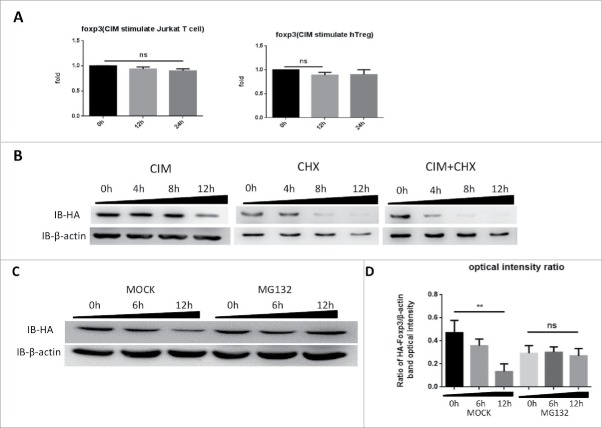
Figure 2.
Cimetidine stimulation of cells leads to Foxp3 degradation rather than expression inhibition. A. Minimal decrease in foxp3 gene expression in response to CIM stimulation. Total RNA was isolated from HA-Foxp3 Jurkat T cells and Human Treg cells at intervals during stimulation with CIM then reverse-transcribed to cDNA and then qPCR for foxp3 and reference gene GAPDH transcripts was carried out. Normalized-fold changes compared to time zero are shown, and t-test used to analyze the correlation between the groups. The two-tailed P value of Jurkat groups and Treg groups are 0.0614 and 0.1271, respectively. B. Protein synthesis inhibitor CHX enhances the decrease in Foxp3 protein seen during incubation with CIM. HA-Foxp3 Jurkat T cells were stimulated with CIM (5 μg/ml) for 0, 4, 8, or 12 h in the presence or absence of CIM (5 μg/ml) or CHX (5 μg/ml). Cell lysates were normalized for protein content and subjected to Western Blotting. C. Proteasome inhibitor MG132 suppressed the reduction of Foxp3 protein in CIM-stimulated Jurkat cells. HA-Foxp3 Jurkat T cells were stimulated with CIM (5 μg/ml) in the presence or absence of MG132 (5 nM). Cell lysates were normalized for protein content and subjected to Western Blotting. The relative expression of HA bands compared to β-actin bands was analyzed as intensity ratio by Image-Pro Plus (D). Depicted are the representative results of at least 3 independent experiments. Data are expressed as means with SD from 3 independent experiment. Statistical significance was calculated using t-test (**P< 0.01 and *P < 0.05).

