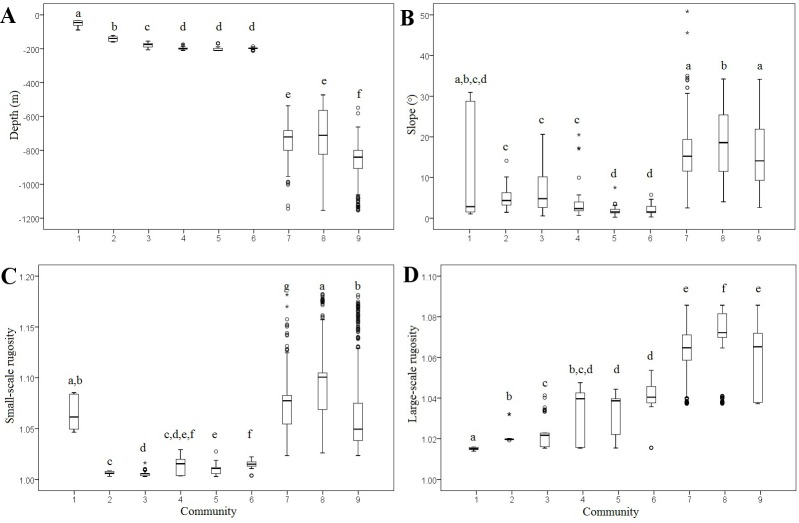
Fig 4. The environmental data (depth, slope, and small- and large-scale ACR rugosity) at the image locations for each of the nine Cobb Seamount communities.
The boxes represent the inter-quartile interval, circles represent outliers, stars represent extreme outliers, and horizontal lines represent the median. The superscript letters represent the output of the Mann-Whitney U tests, where community locations that are significantly different to each other do not share a common letter.

