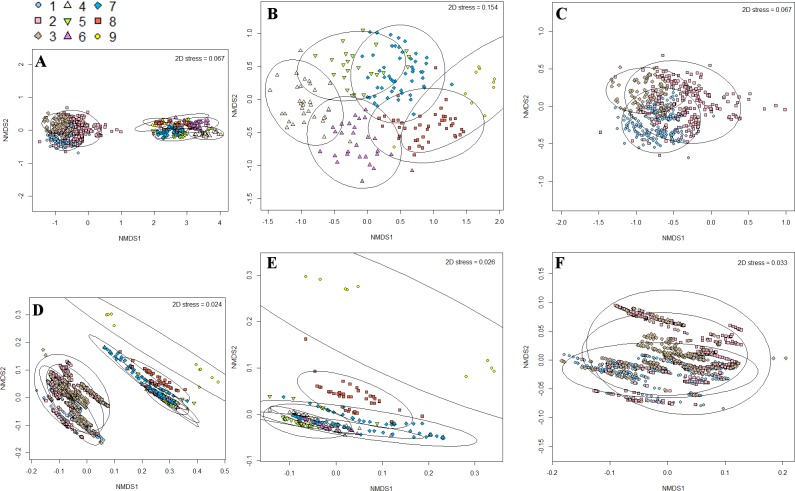
Fig 5. Non-metric multidimensional scaling (NMDS) ordination plots showing the ecological and environmental (dis)similarity between and within nine communities on Cobb Seamount.
NMDS plots were generated from Bray-Curtis similarity matrices of the faunal data for (A) all nine communities, (B) Communities 1 to 6, and (C) Communities 7 to 9. Similarly, NMDS plots were generated from Euclidian similarity matrices of the environmental data for (D) all nine communities, (E) Communities 1 to 6, and (F) Communities 7 to 9. Faunal data were for the presence-absence of 74 taxa, while environmental data include depth, slope, and small- and large-scale rugosity. Each community is represented by a different symbol and encircled by 95% similarity ellipses. The NMDS axes are unique for each plot.

