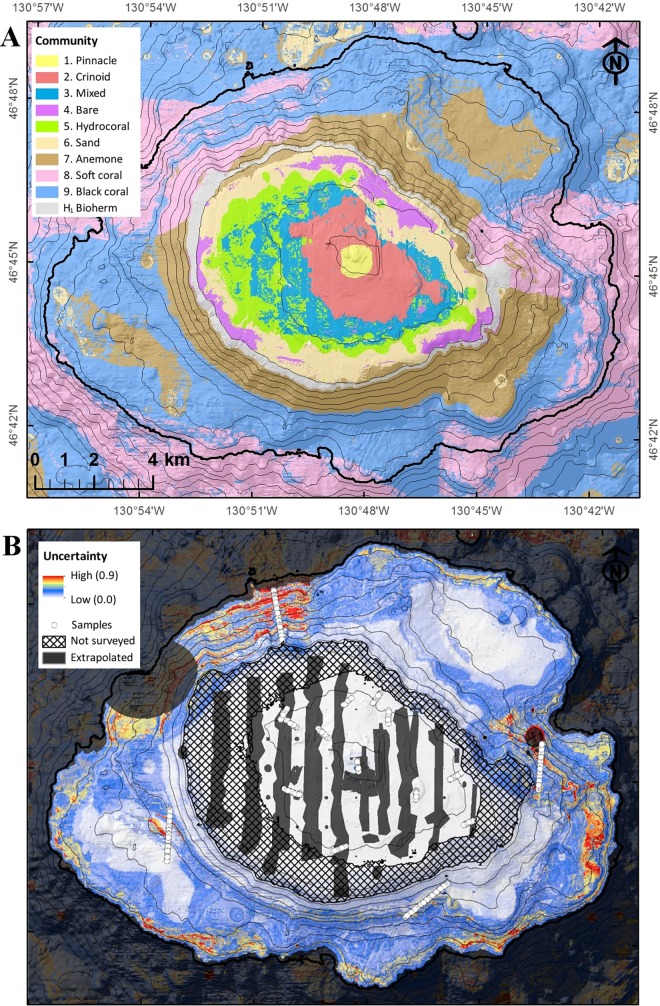
Fig 6. Outputs from the Random Forest modelling.
(A) The predicted distributions of the nine communities, plus the hypothesized Lophelia pertusa bioherm community, and (B) the degree of model uncertainty. Model resolution is 20 by 20 m, thin black lines represent 100 m depth contours, the thick black line represents 1200 m (the approximate depth limit of the image surveys). (A) Each community is represented by a different colour, (B) white circles represent image locations, hatching represents the depth gap not surveyed (211 to 472 m), and dark gray shading represents extrapolated areas (i.e., areas where one or more environmental variable is beyond the sampled range).

