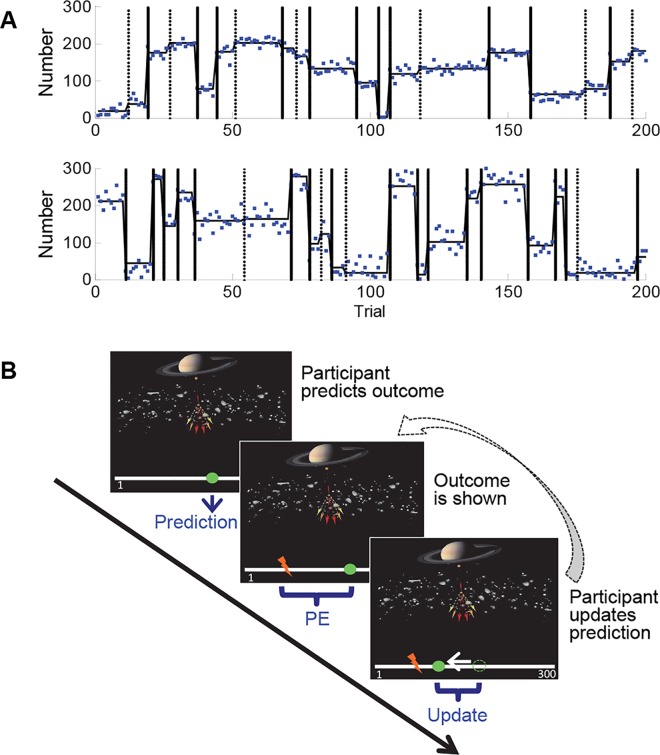
Fig 1. The predictive-inference task.
A. The number outcomes in a low-noise (upper panel) and a high-noise (lower panel) block. The blue dots indicate the number outcomes on each trial; these were drawn from a normal distribution of which the mean (horizontal black line) changed at unsignaled moments (change points). Change points are indicated by the vertical lines, separately for obvious (straight lines) and non-obvious (dotted lines) change points. The SD of the number-generating distribution was constant within each block, but varied between blocks (either 10 or 25). B. Illustration of the task. On each trial, participants predict the next location on a number line, after which they see the actual location (outcome) and update their prediction for the next trial. The number-line locations correspond to the number outcomes shown in plot A.

