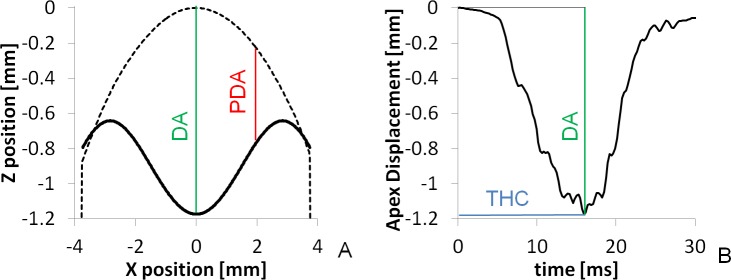
Fig 4. Spatial and temporal deformation profiles.
A. Spatial deformation profile of Model Cornea Saphir 1 (Solid line). Dashed line shows the initial shape of the MC. B. Temporal deformation profile for the same MC. Deformation parameters are indicated: Central Deformation Amplitude (DA, in green), Peripheral Deformation Amplitude (PDA, in red), Time to Highest Concavity (THC, in blue).

