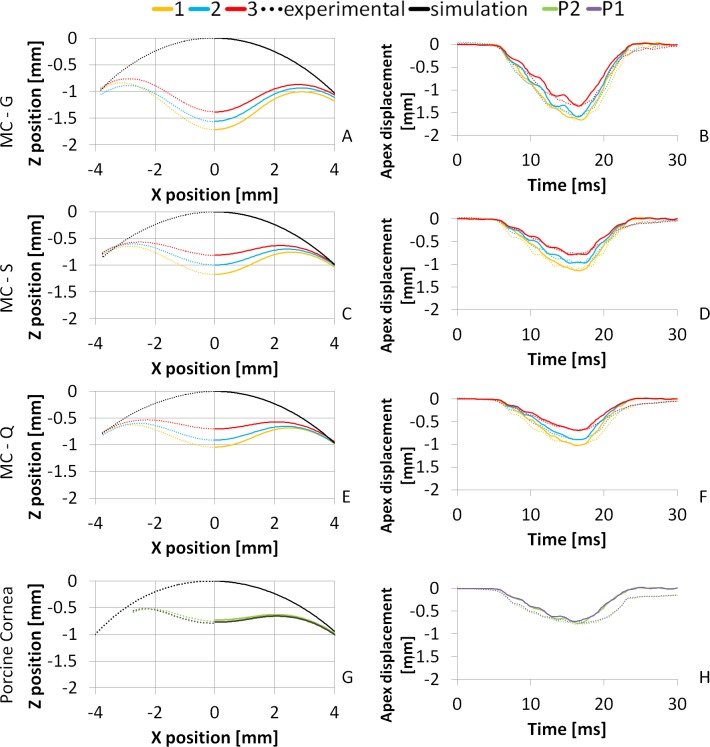
Fig 9. Spatial (left) and temporal (right) deformation profiles for three model corneas and three thicknesses; and the porcine corneas.
A, B: Material G; C, D: Material S; E, F: Material Q; G, H: Porcine (P1 and P2). Black lines represent the initial profile; yellow, blue and red represent the 1, 2 and 3 MC thicknesses (350, 450, 550 μm), respectively. Green and Purple lines represent the two porcine corneas. Dotted lines stand for the measured profile and solid lines stand for the simulated profile using the reconstructed material parameters.

