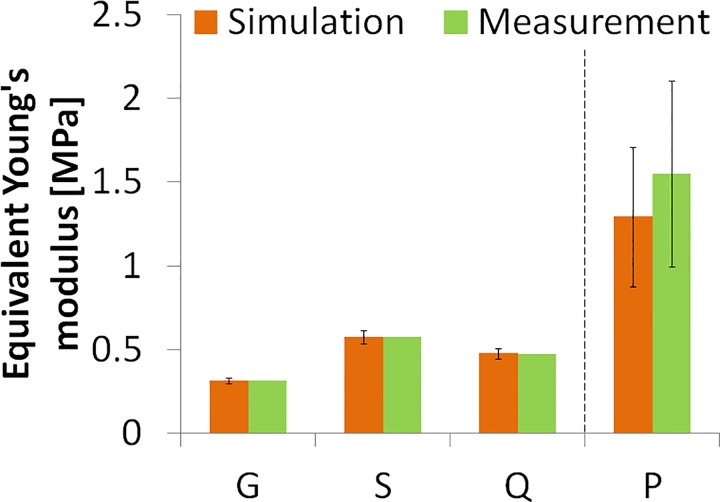
Fig 11. Equivalent Young's moduli from stress-strain measured and simulated stress-strain curves.
Simulated curves use material properties obtained from inverse modeling from air puff data at different thicknesses. Error bars in the simulation data represent the standard deviation across the parameter values from air puff deformation based estimates on corneal samples of different thicknesses. Error bar in measurement data of the porcine cornea (P) represent the standard deviation across samples (n = 2).

