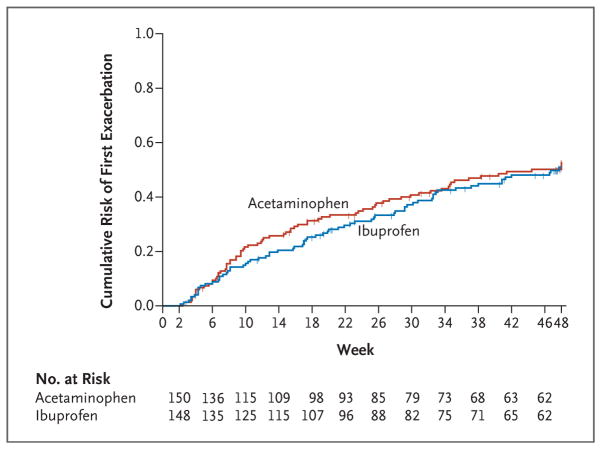
Figure 2. Time to First Asthma Exacerbation.
Shown are Kaplan–Meier curves for the cumulative risk of an asthma exacerbation during the course of the trial. In a Cox proportional-hazards regression analysis, no significant difference was seen between the treatment groups (P = 0.70). Tick marks indicate times at which data were censored owing to end of follow-up or dropout.

