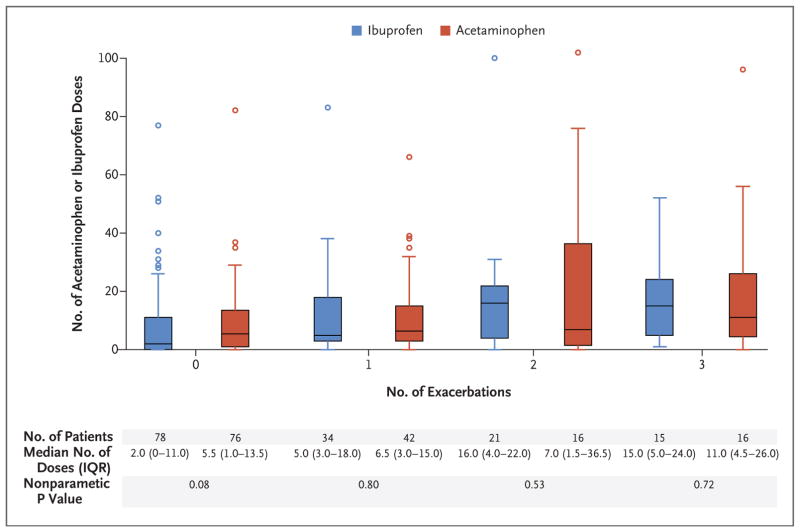
Figure 3. Number of Doses of Acetaminophen or Ibuprofen, According to the Number of Asthma Exacerbations That Led to Treatment with Systemic Glucocorticoids.
Shown is the number of acetaminophen or ibuprofen doses that were administered in a blinded manner during the trial period, stratified according to the number of exacerbations that led to treatment with systemic glucocorticoids during the same period. P values for the comparison of treatments within each systemic glucocorticoid subgroup are based on the Wilcoxon rank-sum test. The horizontal lines in the boxes represent the median number of doses of trial medication (acetaminophen or ibuprofen); the top and bottom edges of the boxes represent the the first and third quartiles; the I bars extend to the lowest and highest data value that is not more than 1.5 times the interquartile range below and above the lower and upper end of the box, respectively, and the circles are individual data points that are more than 1.5 times the interquartile range above the top edges of the box.

