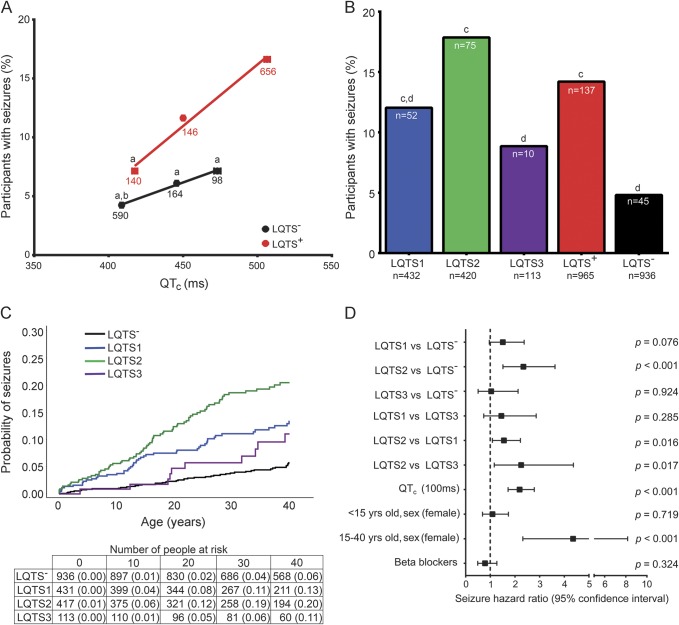
Figure 2. Biomarkers for seizure status.
(A) Positive correlation of QTc to percentage with seizures (n = participants; CMH test, LQTS+ p < 0.05, LQTS− p = not significant, χ2, p < 0.001; ap < 0.05 vs LQTS+ QTc prolongation; bp < 0.001 vs LQTS+ borderline QTc prolongation; LQTS+ R2 = 0.9844, slope = 0.1045; LQTS− R2 = 0.9944, slope = 0.0454). (B) Prevalence of participants with seizures based on type of LQTS (N = total participants, n = participants with seizures, χ2: LQTS1 vs LQTS2 vs LQTS3 vs LQTS−, p < 0.001; LQTS1 vs LQTS2 vs LQTS3, p < 0.05; cp < 0.001 vs LQTS−; dp < 0.05 vs LQTS2). (C) Cumulative probability of seizures (log rank p < 0.001). (D) Multivariate analysis of seizure risk. CMH = Cochran-Mantel-Haenszel; LQTS = long QT syndrome; QTc = corrected QT interval.

