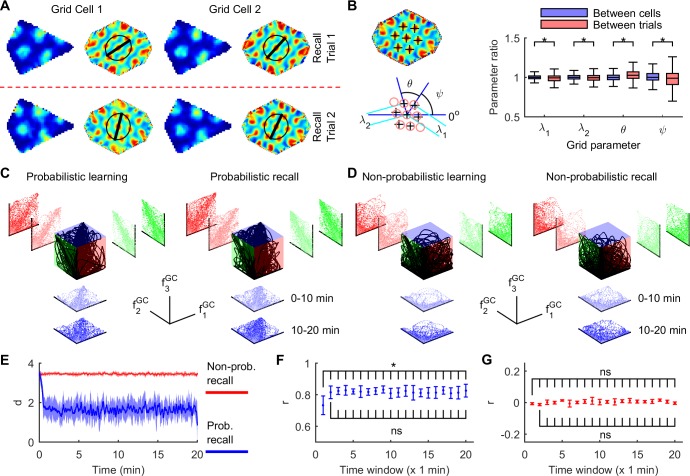
Fig 5. Probabilistic grid cells exhibit attractor dynamics during learning and recall.
(A) Typical probabilistic grid cell response patterns, showing greater similarity between cells in the same trial, than in the same cell across trials (major axis shown of elliptical fit to six inner autocorrelogram peaks). (B) Each autocorrelogram was fitted using a regular grid template [43] (lower left, 200 grid cells × 10 independent learning trials × 2 recall localization trials). All grid parameter ratios (right) show greater variability between trials (same cell) than between cells (same trial) (P = {2.7×10−22,2.8×10−13,4.8×10−16,4.0×10−13}, F1,1998 = {33.9,17.4,14.2,53.6}, parameters = {λ1,λ2,θ,ψ}, Brown-Forsythe test for equal variance). (C) Grid activity space within a single probabilistic grid module shows clustering along the attractor (unit diagonal, perfect correlation), during naïve learning (left) and disoriented recall (right). Activity, fGC, of three grid cells are shown. (D) As per (C) but from non-probabilistic learning (left) and recall (right) where the boundary prediction error was always set to one. Otherwise, the distributed grid code and association maps, associative learning, and stochastic resampling were identical to SIFM, demonstrating that the attractor-like properties of SIFM require boundary prediction error feedback. (E) The Euclidean distance, d (mean ± S.D., 10 s boxcar smoothing), from the attractor (200 grid cells, grid scale module 1) from probabilistic (blue) and non-probabilistic (red) recall trials from (C) and (D). (F) Pearson’s correlation (r, mean ± SD, n = 10 independent recall trials) between grid cell activity (200 grid cell pairs) during Recall Trial 1 series of (A). Activity correlation changed significantly during re-orientation (P = 2.4×10⁻⁵, F19,171 = 3.23, one-way repeated measures ANOVA), increasing from the first minute (all P < 0.02, 19 paired t-tests, FDR corrected), then plateaued (all P > 0.2, 18 paired t-tests). (G) As per (F) but during the non-probabilistic recall series in (D) and (E). There was no change in the activity correlation during attempted re-orientation (P = 0.44, F19,171 = 1.03, one-way repeated measures ANOVA).

