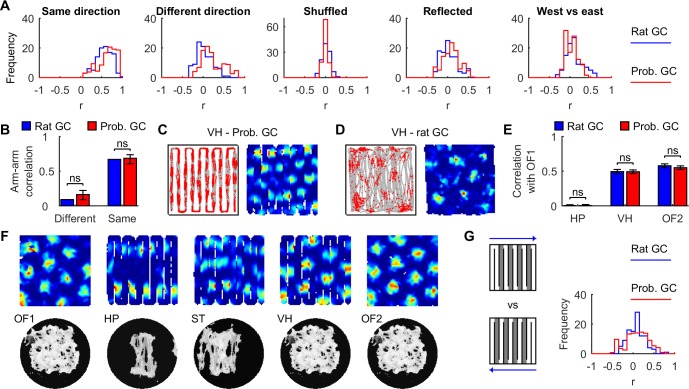
Fig 7. Grid fragmentation is an emergent property of probabilistic grid cells.
(A) Distributions of mean correlations between arms where the rats ran in the: same local direction (odd-odd and even-even arms, excluding 1 and 10); different local direction (odd-even arms, excluding 1 and 10); same local direction but randomly shuffled spatial bins; different local direction but rate vectors along odd-numbered arms were reflected along north-south; and different global directions (all pairs of arms, excluding 1 and 10). (B) The median correlation between arms of the same or different local running direction (mean of 73 directionally-insensitive rat grid cells, compared to 95% C.I. from 104 resampling means of 73 probabilistic grid cells). (C, D). Regular grid patterns along virtual hairpin (VH) trajectories in an open arena. (E) Spatial correlations between rate maps in the first open field (OF1) and: the hairpin maze (HP), virtual hairpin maze (VH) and a second open field (OF2), were indistinguishable between model and rat grid cells (mean ± SEM; OF1 vs HP, P = 0.99, t199.6 = 0.014; OF1 vs VH, P = 0.96, t52.6 = -0.048; OF1 vs OF2, P = 0.47, t207.1 = -0.73; Welch’s t-test). (F) Probabilistic grid cell rate maps (top row) and association maps (bottom row) from the hairpin maze series in a 1.5 m square arena: learning in an open field (OF1), learning in a hairpin maze (HP), learning in a semi-transparent hairpin maze (ST), recall in a familiar open field using a hairpin trajectory (virtual hairpin—VH), and recall in a familiar open field using a random trajectory (OF2). (G) Distributions of mean correlations between arms (shaded, excluding 1 and 10) where runs were in different global directions but the same local direction. Rat grid cell displays were constructed from data published previously [36], with permission from D. Derdikman, M.-B. Moser and E. Moser.

