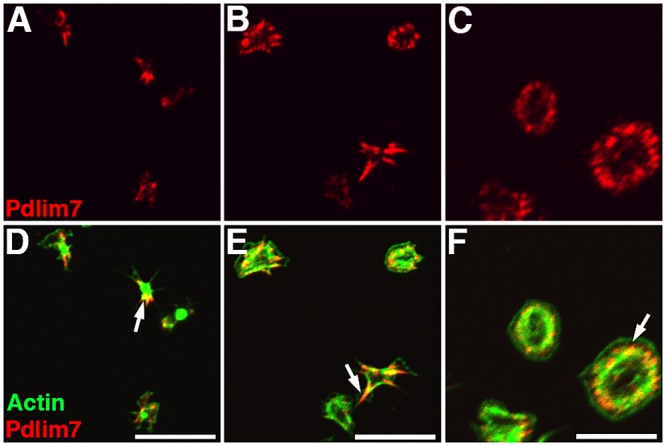
Fig 4. Subcellular localization of Pdlim7 and F-actin during various phases of platelet spreading.

Confocal images of thrombin-activated WT platelets spread on glass for 45 minutes, visualizing early (A, D), subsequent (B, E), and late stages (C, F). Double immunofluorescence detection of Pdlim7 and F-actin distribution. Top row (A-C) shows confocal images of WT platelets immunostained for Pdlim7 (red). Bottom row (D-F) shows merged channels of Pdlim7 (red) and F-actin (green). Arrows indicate distribution of Pdlim7 proteins on F-actin filaments at progressively later time points during platelet spreading. Scale bar = 10 μm.
