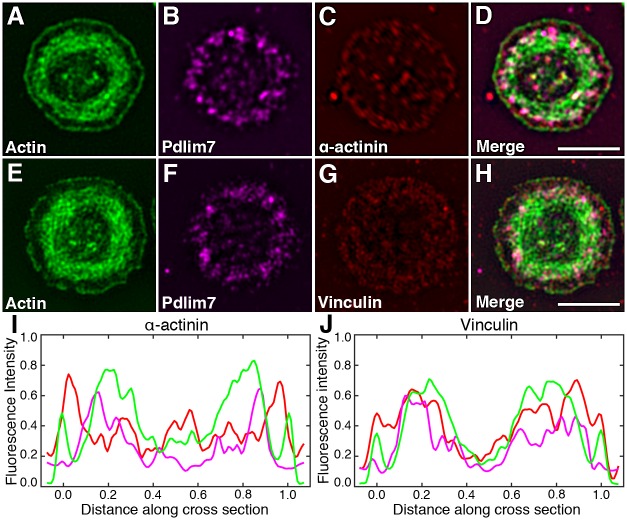
Fig 6. Organization of Pdlim7, actin, and actin-associated proteins in platelets displaying the final round shape morphology.
SIM images of thrombin activated WT platelets after completion of spreading. Triple immunofluorescence detection of Pdlim7 distribution in context of α-actinin and vinculin. Top row shows SIM images of platelets immunostained for (A) F-actin (green), (B) Pdlim7 (magenta), (C) α-actinin (red), and (D) Merge. Bottom row shows SIM images of WT platelets immunostained for (E) F-actin, (F) Pdlim7 (magenta), (G) vinculin (red), and (H) Merge. Line scan fluorescence intensity profiles of platelet cross-sections revealing overlapping and distinct localizations of actin (green), Pdlim7 (magenta), α-actinin (red) (I), and of actin (green), Pdlim7 (magenta), vinculin (red) (J). Cell width as well as fluorescence intensities of individual proteins were normalized over seven platelets for each set, respectively. Scale bar = 2.5μm.

