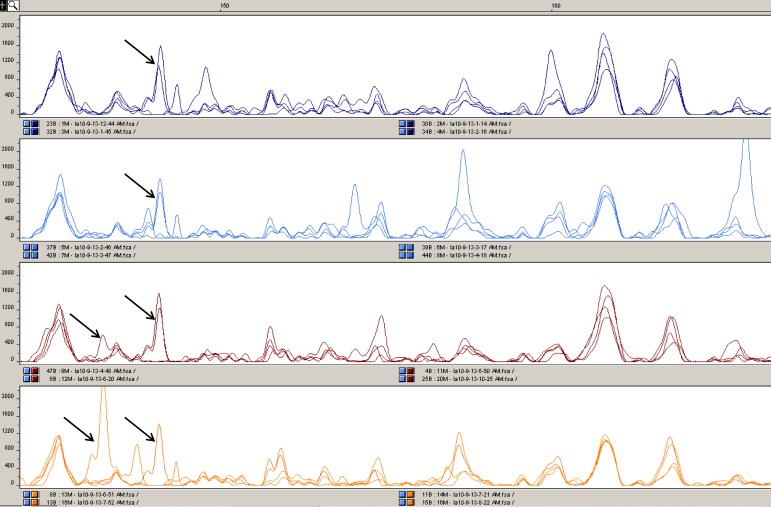
Fig 3. Example of MSAP spectra showing polymorphism between standard cultivar and derived somaclonal individuals.
Top window shows MSAP spectra obtained by analysis of four different individuals of LX987 standard cultivar by using HpaII/MspI-GCAT + EcoRI-AGG (FAM) adaptors. Second window shows MSAP spectra obtained by analysis of four different individuals of AS208 “bread quality” somaclones by using identical adaptors as for the samples in top window. Third window shows MSAP spectra obtained by analysis of four different individuals of YM66 standard cultivar by using identical adaptors as for the samples in top window. Fourth window shows MSAP spectra obtained by analysis of four different individuals of AS34 dwarfing somaclones by using identical adaptors as for the samples in top window.

