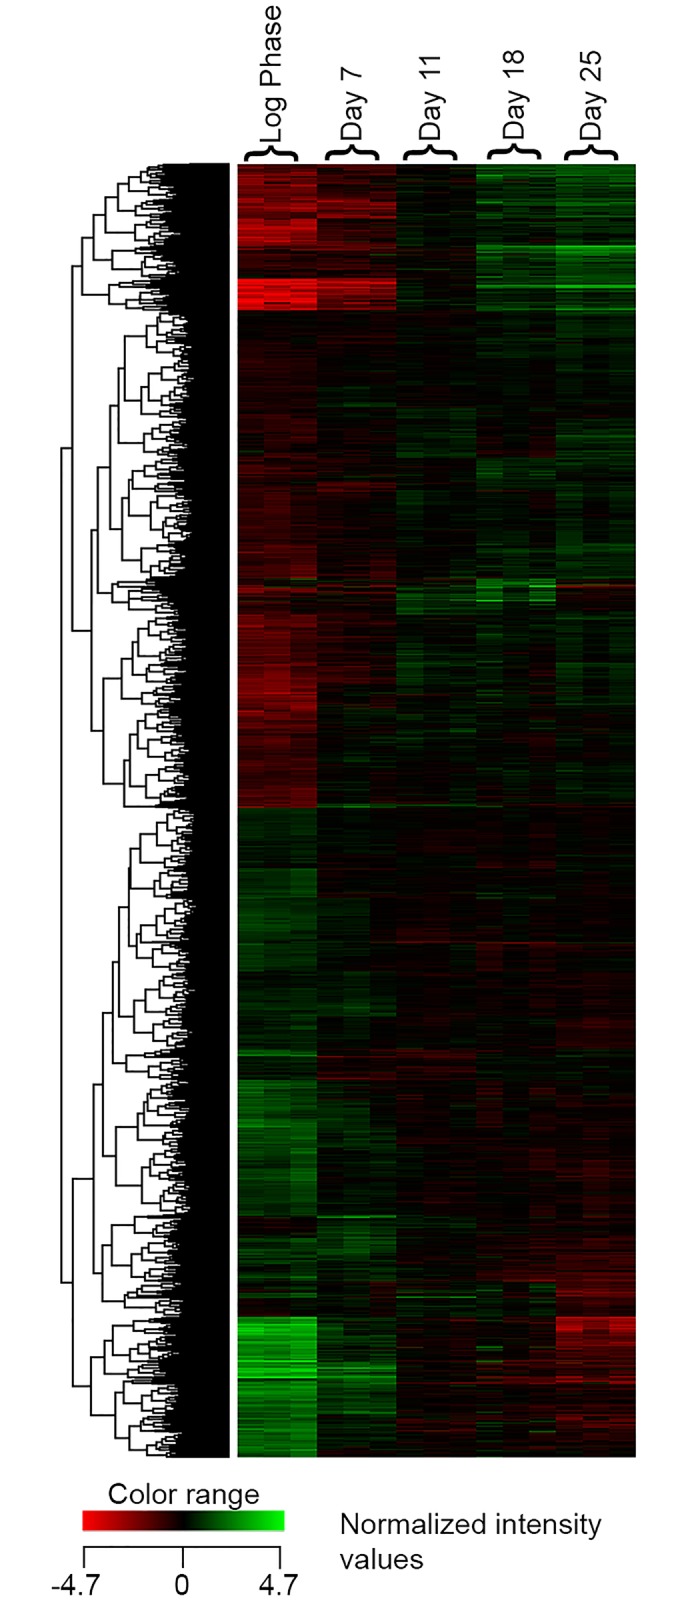
Fig 3. RNA Microarray Heatmap of Gene Expression.

Hierarchically clustered (Euclidian similarity measure, clustered using Ward’s linkage rule) heat map of gene expression changes in A549 cells cultured in Ham’s F12 for up to 25 days; the heat map shows normalised intensity values of significant genes regulated up or down two-fold or more.
