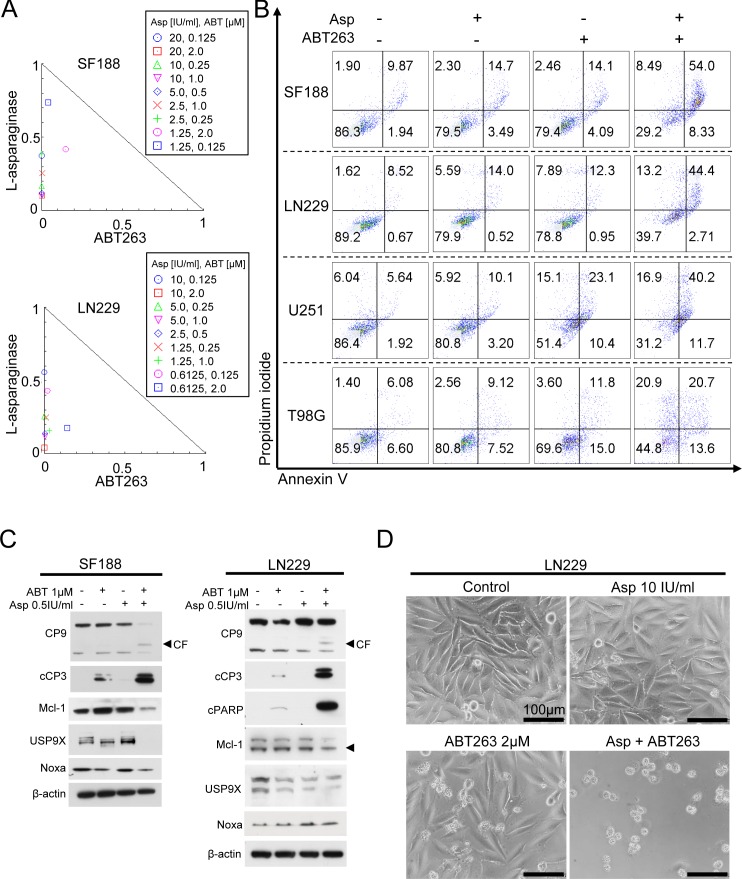
Figure 3. Combined treatment with L-asparaginase (Asp) and ABT263 results in anti-proliferative and pro-apoptotic synergism.
A., SF188 and LN299 glioblastoma cells were treated for 72h with L-asparaginase and ABT263 as indicated prior to performing MTT-assays. Normalized isobolograms were calculated using the CompuSyn software. The connecting line represents additivity. Data points located below the line indicate a synergistic drug-drug interaction and data points above the line indicate an antagonistic drug-drug interaction. B., Representative flow plots of SF188 (Asp 0.5IU/ml, ABT263 1μM, 24h), LN229 (Asp 2IU/ml, ABT263 0.5μM, 24h), U251 (Asp 2IU/ml, ABT263 1.5μM, 24h) and T98G (Asp 1IU/ml, ABT263 1μM, 48h) glioblastoma cells subjected to treatment with L-asparaginase, ABT263 or the combination prior to staining for annexin V/propidium iodide and flow cytometric analysis. C., SF188 and LN229 glioblastoma cells were treated with L-asparaginase and/or ABT263 as indicated. Western blot analysis was performed for caspase 9 (CP9), cleaved caspase 3 (cCP3), cleaved PARP (cPARP), Mcl-1, Usp9X and Noxa. Actin expression was determined to confirm equal protein loading. CF = cleaved fragment; arrow head represents specific band for Mcl-1. D., Representative microphotographs of LN229 glioblastoma cells treated with 10 IU/ml L-asparaginase, 2 μM ABT263 or the combination for 48h. Magnification, x40; scale bar, 100 μm.

