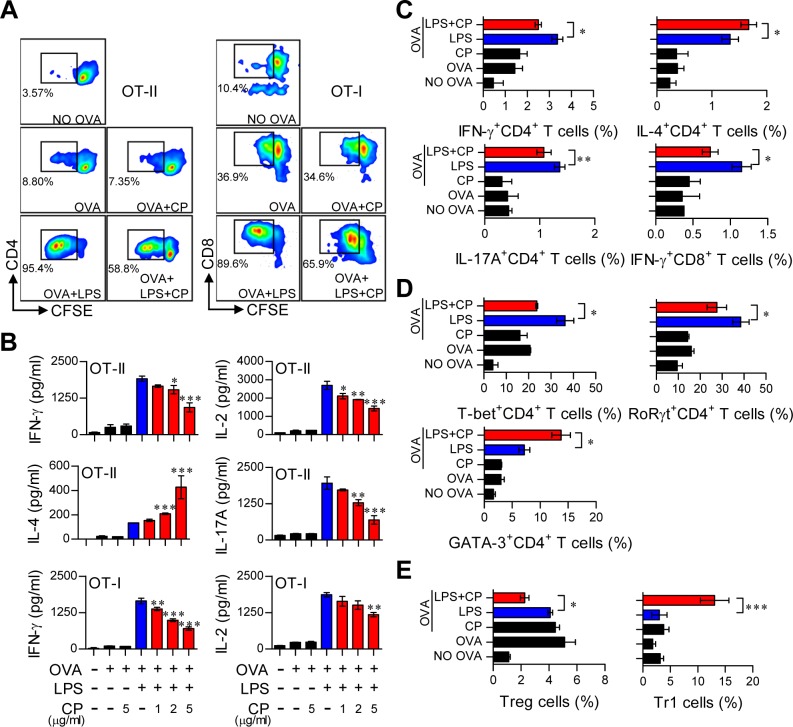
Figure 6. Cisplatin reduced the capacity of LPS-activated DCs to stimulate T cell proliferation and the Th1 response, polarized the Th2-type T cell response, and facilitated the generation of IL-10-producing Tr1 T cells.
Transgenic OVA-specific CD4+ T cells (OT-II) and transgenic OVA-specific CD8+ T cells (OT-I) were isolated; stained with CFSE; co-cultured for 96 h with DCs treated with LPS (100 ng/ml), cisplatin (5 μg/mL), or LPS and cisplatin; and then pulsed with OVA323-339 (1 μg/ml) for OVA-specific CD4+ T cells or OVA257-264 (1 μg/ml) for OVA-specific CD8+ T cells. A. The proliferation of CD4+ (left panel) and CD8+ T cells (right panel) was then assessed by flow cytometry. The T cell proliferation data are shown as one representative plot out of three independent experiments.B. Cytokine levels in the culture supernatants from CD4+ T cells (OT-II) and CD8+ T cells (OT-I) in the T cell proliferation experiments were measured by ELISA. C. The bar graphs show intracellular cytokine production (IFN-γ, IL-4, or IL-17A) in CD4+ andCD8+ T cells. D. The bar graphs show T cell transcription factor expression (T-bet for Th1, GATA-3 for Th2 and RoRγt for Th17) in CFSE-labeled CD4+ cells. E. The bar graphs show the percentages of Tregs and IL-10-producing Tr1 cells among CD4+ T cells. The values shown represent the mean ± SD (n = 4 samples) from one representative plot out of three independent experiments. *p < 0.05, **p < 0.01, and ***p < 0.001 compared with T cell/OVA323-339+LPS-pulsed DCs or T cells/OVA257-264 +LPS-pulsed DCs in the presence and absence of cisplatin.

